NON-LINEAR REGRESSION (Statistics of Two Variables)
advertisement

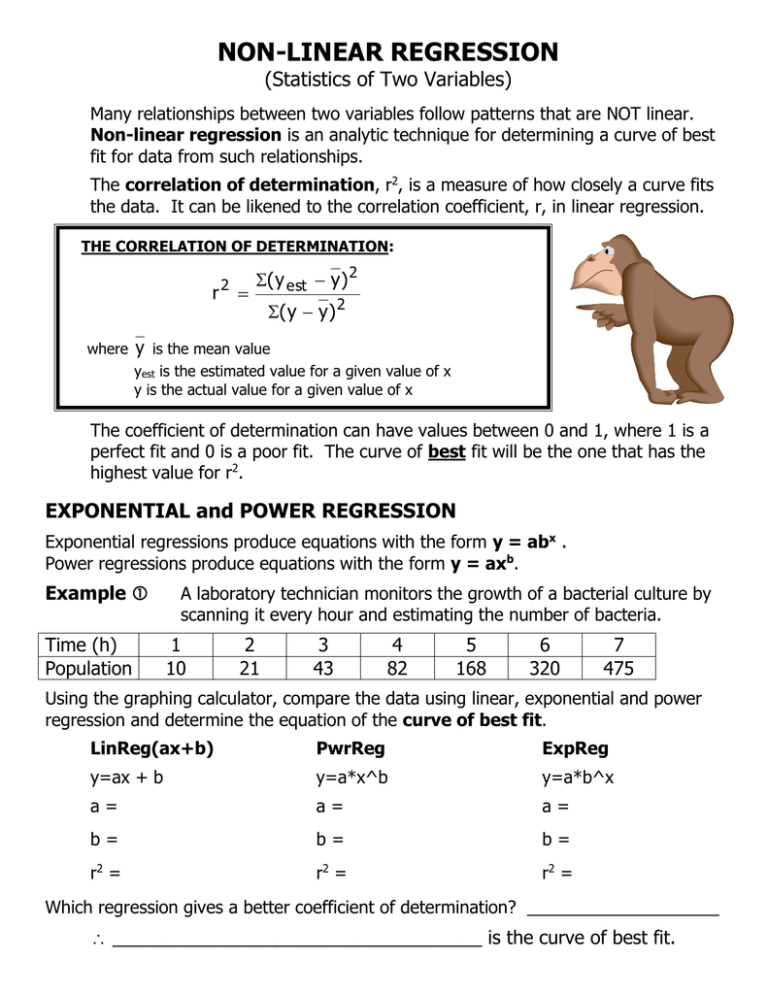
NON-LINEAR REGRESSION (Statistics of Two Variables) Many relationships between two variables follow patterns that are NOT linear. Non-linear regression is an analytic technique for determining a curve of best fit for data from such relationships. The correlation of determination, r2, is a measure of how closely a curve fits the data. It can be likened to the correlation coefficient, r, in linear regression. THE CORRELATION OF DETERMINATION: r where 2 ( y est y) 2 ( y y) 2 y is the mean value yest is the estimated value for a given value of x y is the actual value for a given value of x The coefficient of determination can have values between 0 and 1, where 1 is a perfect fit and 0 is a poor fit. The curve of best fit will be the one that has the highest value for r2. EXPONENTIAL and POWER REGRESSION Exponential regressions produce equations with the form y = abx . Power regressions produce equations with the form y = axb. Example Time (h) Population A laboratory technician monitors the growth of a bacterial culture by scanning it every hour and estimating the number of bacteria. 1 10 2 21 3 43 4 82 5 168 6 320 7 475 Using the graphing calculator, compare the data using linear, exponential and power regression and determine the equation of the curve of best fit. LinReg(ax+b) PwrReg ExpReg y=ax + b y=a*x^b y=a*b^x a= a= a= b= b= b= r2 = r2 = r2 = Which regression gives a better coefficient of determination? ____________________ ____________________________________ is the curve of best fit. POLYNOMIAL REGRESSION (Quadratic or Cubic) Polynomial regressions produce equations with the form y = ax2 + bx + c (quadratic) or y = ax3 + bx2 + cx + d (cubic). Example The laboratory technician takes further measurements of the bacterial culture in example : 1 Time (h) Population 10 2 21 3 43 4 82 5 6 7 8 9 10 11 12 13 14 168 320 475 630 775 830 980 1105 1215 1410 Using the graphing calculator, compare the data using exponential, power, and polynomial regression. ExpReg PwrReg QuadReg CubicReg y=a*b^x y=a*x^b y=ax2+bx+c y=ax3+bx2+cx+d a= a= a= a= b= b= b= b= r2 = r2 = c= c= r2 = d= r2 = _____________________________________________ is the curve of best fit. Homework: p.191–193 #1, 2, 4, 5, 7 use graphing calculator


