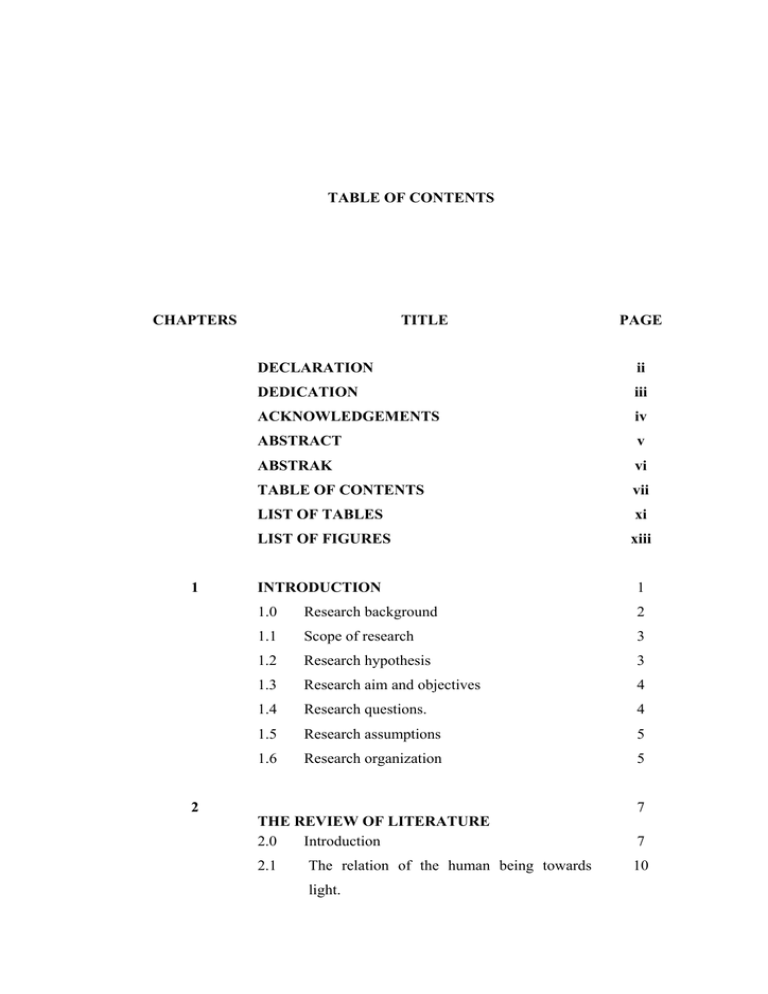
TABLE OF CONTENTS CHAPTERS TITLE PAGE DECLARATION
advertisement

TABLE OF CONTENTS CHAPTERS 1 TITLE PAGE DECLARATION ii DEDICATION iii ACKNOWLEDGEMENTS iv ABSTRACT v ABSTRAK vi TABLE OF CONTENTS vii LIST OF TABLES xi LIST OF FIGURES xiii INTRODUCTION 1 1.0 Research background 2 1.1 Scope of research 3 1.2 Research hypothesis 3 1.3 Research aim and objectives 4 1.4 Research questions. 4 1.5 Research assumptions 5 1.6 Research organization 5 7 2 THE REVIEW OF LITERATURE 2.0 Introduction 7 2.1 10 The relation of the human being towards light. 2.11 The relation of human behaviour towards 10 light 2.1.2 The relation of the human psychology 15 towards light. 2.1.3 The relation of the human physiology 16 towards light. 2.2 The Relation of Light and Commercial 20 Buildings 2.3 3 Conclusion 24 RESEARCH METHODOLOGY 25 3.0 Introduction 25 3.1 Research overview 26 3.2 Building framework 29 3.2.1 Definition of shopping complex 30 3.2.2 Factors affecting lighting 31 3.2.3 Factors affecting patronage 31 3.2.4 Basic benchmarking 33 3.2.5 Building inventory 34 3.2.6 Building selection 44 3.3 Data collection 49 3.3.1 Review on lighting variable 51 3.3.1.1 Digital camera in image processing study 51 3.3.1.2 Concept of illumination in computer graphics 51 3.3.1.3 Image processing program review 54 3.3.1.4 Digital camera and luminance meter 59 comparison 3.3.2 Review on patronage count 73 3.3.3 Physical measurements 77 3.3.3.1 Condition and time for data collection 77 3.3.3.2 Research instrument 79 3.3.3.3 Patronage count 80 3.3.3.4 Luminance reading 82 3.4 Data analysis 82 3.4.1 Tabulation of patronage count and luminance 83 level 3.42 Comparison of data of Summit USJ and 83 Subang Parade 4 5 6 3.5 Pilot Study 84 3.6 Amendments on data collection 87 3.6.1 Amendments on patronage count 88 3.6.2 Amendments on luminance reading 91 3.7 92 Amendments on data analysis method RESEARCH ANALYSIS 93 4.0 Introduction 93 4.1 Building description 93 4.1.1 Subang Parade 93 4.1.2 Summit USJ 98 4.2 Description of data 103 4.2.1 Subang Parade 104 4.2.2 Summit USJ 116 4.3 Daylight component analysis 130 BEHAVIORAL SURVEY STUDY 131 5.0 Introduction 131 5.1 Survey set up 131 5.1.1 Sampling and questionnaire design 131 5.1.2 Data collection 134 5.2 Survey finding and analysis 134 5.2.3 Conclusion 157 CONCLUSION AND RESEARCH 159 METHODOLOGY REVIEW 6.0 Introduction 159 6.1 Conclusion of research 160 7 6.2 Review of research methodology 160 6.3 Recommendation for future research 162 BIBLIOGRAPHY 165 LIST OF TABLES TABLE NO. TITLE PAGE 3.1 Table showing building inventory checklist 36 3.2 Table showing anchor tenants of shopping complexes 38 3.3 Table showing type of lighting used at shopping 39 complexes. 3.4 Table showing rating of shopping complexes 40 3.5 Luminance level represented in each pixel that builds up 53 the image above 3.6 Mixed background readings – Set 1 62 3.7 Mixed background readings – Set 2 63 3.8 Dark background readings – Set 1 64 3.9 Dark background readings – Set 2 65 3.10 Data Filtering for Red Set 67 3.11 Data Filtering for Blue Set 68 3.12 Data Filtering for Green Set 70 3.13 Data Filtering for Yellow Set 71 3.14 Overall background readings 72 3.15 Table showing luminance level of each pixel that builds 87 up the picture 4.1 Table below indicates luminance value of Subang Parade 111 – 1st floor 4.2 Table below indicates luminance value of Subang Parade – Ground floor and lower ground floor. 112 4.3 Pattern of light distribution at 1st floor of Subang Parade 113 4.4 Pattern of light distribution at ground floor and lower 114 ground floor of Subang Parade. 4.5 Table showing patronage count for Subang Parade 116 4.6 Table showing patronage count for Summit USJ. 124 4.7 Table showing pattern of light distribution for Summit 126 USJ. 4.8 Table showing pattern of light distribution for Summit 127 USJ. 4.9 Table showing patronage count for Summit USJ. 128 4.10 Table showing patronage count for Summit USJ. 129 5.1 Table showing survey on factors that affect patronage in 133 Subang Parade LIST OF FIGURES FIGURES NO. 2.1 TITLE Diagram showing relation of topics discussed in the PAGE 9 review 2.2 Diagram showing relation between light and work 13 3.1 Table showing organization of the research 28 methodology 3.2 Table showing rating system by Darling (2004) 35 3.3 Table showing retail trade analysis of Waupaca 46 district. 3.4 Map showing population distribution of Klang Valley 47 3.5 Map showing location of shopping complexes within 48 Klang Valley 3.6 Map showing location of Subang Jaya & schedule of 49 population distribution. 3.7 An image with a resolution of 1375 x 1402 pixels 52 3.8 Illustration on how luminance reading is taken using 54 a luminance meter. 3.9 Lux reading versus digital camera mean 72 3.10 Infodev counting process. 75 3.11 Infodev’s horizontally located and vertically located 76 counting sensors. 3.12 Hourly global illuminance for Klang Valley, 78 Malaysia 3.13 Handheld manual counter used to count patronage 80 3.14 Counting stations (green) overlooking imaginary 81 count line (blue) 3.15 Plan showing checkpoints for patronage count of 81 Subang Parade. 3.16 Sidelit atria (left) and toplit atria (right) 84 3.17 Picture of lighting condition processed using PCI 85 Geomatica 3.18 Histogram showing frequency of different luminance 86 value 3.19 Table showing general properties of processed 86 picture 3.20 Counting stations (green) overlooking imaginary 89 count line (blue) 3.21 Plan showing checkpoints for patronage count of 90 Subang Parade. 3.22 Plan showing checkpoints for patronage count 90 Summit USJ. 3.23 Picture taken using fish eye lens gives a wider angle 91 (left) while common lense is limited to either a horizontal or a vertical view only 4.1 Lower ground plan, ground floor plan and 1st floor 95 plan of Subang Parade. 4.2 Perspective showing front, right and left elevation of 95 Subang Parade 4.3 Location plan & openings to side-lit atrium of 96 Subang Parade 4.4 View of side-lit atrium from inside 97 4.5 Top-lit atrium at Subang Parade 97 4.6 Top-lit atrium at west wing of Subang Parade 98 4.7 Types of artificial light used at Subang Parade 99 4.8 Floor plans of Summit USJ- lower ground to second 100 floor 4.9 Floor plans of Summit USJ- third to fourth floor 101 4.10 Location plan & main entrance to Summit USJ. 101 4.11 Perspective showing left, right and front elevation of 102 Summit USJ 4.12 Incandescent downlights on typical floor and 103 concealed incandescent light at ground floor level. 4.13 Luminance level of pictures taken at Subang Parade – 104 1st floor 4.14 Luminance level of pictures taken at Subang Parade – Ground floor 107 4.15 Luminance level of pictures taken at Subang Parade – 110 Lower ground floor 4.16 Plan indicating patronage count checkpoints of Subang Parade. 115 4.17 Luminance level of pictures taken at Summit USJ – 117 3rd floor 4.18 Luminance level of pictures taken at Summit USJ – 119 2nd floor 4.19 Luminance level of pictures taken at Summit USJ – 120 1st floor 4.20 Luminance level of pictures taken at Summit USJ – 122 ground floor 4.21 Luminance level of pictures taken at Summit USJ – 123 lower ground floor 4.22 Plan indicating patronage count checkpoints at 129 Summit 5.1 Pie chart & schedule showing feedback for question 135 1 5.2 Pie chart & schedule showing feedback for question 136 2 5.3 Pie chart & schedule showing feedback for question 3 137 5.4 Pie chart & schedule showing feedback for question 138 4 5.5 Pie chart & schedule showing feedback for question 139 5 5.6 Pie chart & schedule showing feedback for question 140 6 5.7 Pie chart & schedule showing feedback for question 141 7 5.8 Pie chart & schedule showing feedback for question 142 8 5.9 Pie chart & schedule showing feedback for question 143 9 5.10 Pie chart & schedule showing feedback for question 144 10 5.11 Pie chart & schedule showing feedback for question 145 11 5.12 Pie chart & schedule showing feedback for question 146 12 5.13 Pie chart & schedule showing feedback for question 147 13 5.14 Pie chart & schedule showing feedback for question 148 14 5.15 Pie chart & schedule showing feedback for question 149 15 5.16 Pie chart & schedule showing feedback for question 150 16 5.17 Pie chart & schedule showing feedback for question 151 17 5.18 Pie chart & schedule showing feedback for question 152 18 5.19 Pie chart & schedule showing feedback for question 19 153 5.20 Pie chart & schedule showing feedback for question 154 20 5.21 Pie chart & schedule showing feedback for question 155 21 5.22 Pie chart & schedule showing feedback for question 22 156


