FROM THE TAX POLICY CENTER
®
tax notes
Which Industries Pay Corporate
Income Taxes?
By Eric Toder
Recent news stories have focused on large corporations that pay little or no income tax. At the same
time, however, the United States still collects significant amounts of revenue from the corporate
income tax. Over the 10-year period, 1999-2008,
total corporate income tax liability after credits
amounted to $2.3 trillion, an average of about $234
billion per year.
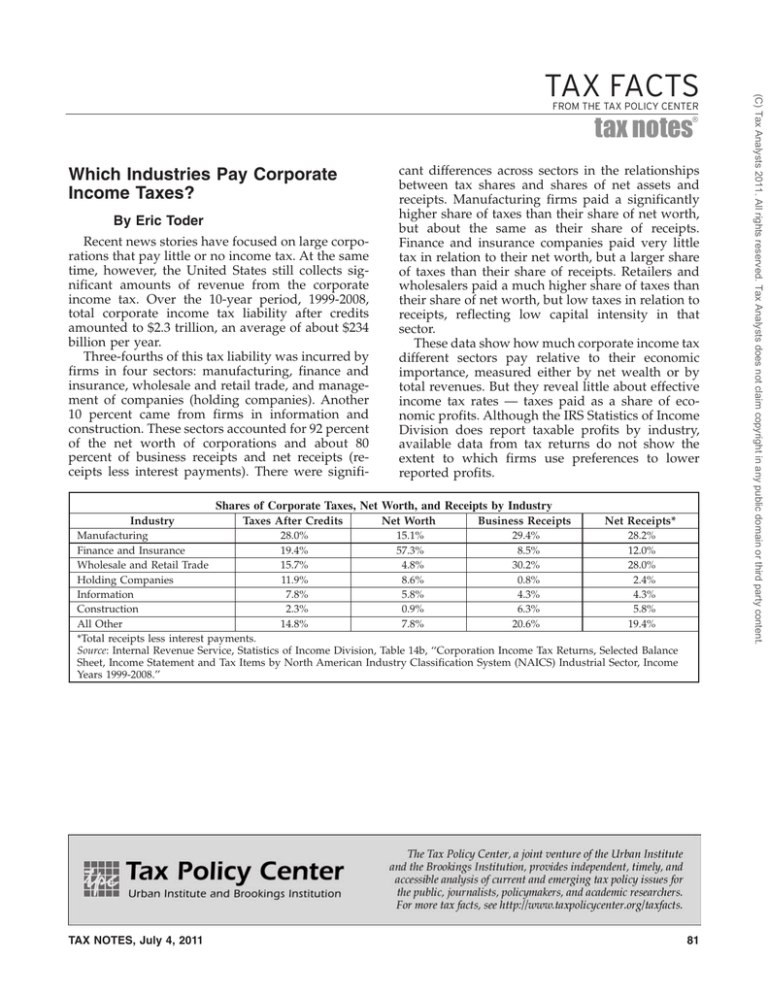
Three-fourths of this tax liability was incurred by
firms in four sectors: manufacturing, finance and
insurance, wholesale and retail trade, and management of companies (holding companies). Another
10 percent came from firms in information and
construction. These sectors accounted for 92 percent
of the net worth of corporations and about 80
percent of business receipts and net receipts (receipts less interest payments). There were signifi-
cant differences across sectors in the relationships
between tax shares and shares of net assets and
receipts. Manufacturing firms paid a significantly
higher share of taxes than their share of net worth,
but about the same as their share of receipts.
Finance and insurance companies paid very little
tax in relation to their net worth, but a larger share
of taxes than their share of receipts. Retailers and
wholesalers paid a much higher share of taxes than
their share of net worth, but low taxes in relation to
receipts, reflecting low capital intensity in that
sector.
These data show how much corporate income tax
different sectors pay relative to their economic
importance, measured either by net wealth or by
total revenues. But they reveal little about effective
income tax rates — taxes paid as a share of economic profits. Although the IRS Statistics of Income
Division does report taxable profits by industry,
available data from tax returns do not show the
extent to which firms use preferences to lower
reported profits.
Shares of Corporate Taxes, Net Worth, and Receipts by Industry
Industry
Taxes After Credits
Net Worth
Business Receipts
Net Receipts*
Manufacturing
28.0%
15.1%
29.4%
28.2%
Finance and Insurance
19.4%
57.3%
8.5%
12.0%
Wholesale and Retail Trade
15.7%
4.8%
30.2%
28.0%
Holding Companies
11.9%
8.6%
0.8%
2.4%
Information
7.8%
5.8%
4.3%
4.3%
Construction
2.3%
0.9%
6.3%
5.8%
All Other
14.8%
7.8%
20.6%
19.4%
*Total receipts less interest payments.
Source: Internal Revenue Service, Statistics of Income Division, Table 14b, ‘‘Corporation Income Tax Returns, Selected Balance
Sheet, Income Statement and Tax Items by North American Industry Classification System (NAICS) Industrial Sector, Income
Years 1999-2008.’’
TAX NOTES, July 4, 2011
81
(C) Tax Analysts 2011. All rights reserved. Tax Analysts does not claim copyright in any public domain or third party content.
TAX FACTS

