FROM THE TAX POLICY CENTER
®
tax notes
Who Pays No Income Tax?
By Roberton Williams
During the 2008 election campaign, President Obama
proposed to create or expand a variety of refundable tax
credits, most notably his Making Work Pay credit. Refundability was key for Obama — that’s the only way to
make credits available to people who pay little or no tax.
Critics decried the proposals, asking how you can cut
taxes for people who pay no tax. The Tax Policy Center
(TPC) estimated that, under then current law, 38 percent
of all nondependent tax units would pay no income tax
in 2009.
Earlier this year, Obama signed into law the American
Recovery and Reinvestment Tax Act of 2009 (P.L. 111-5),
which, among other things, temporarily put into place
some of the refundable credits proposed during the
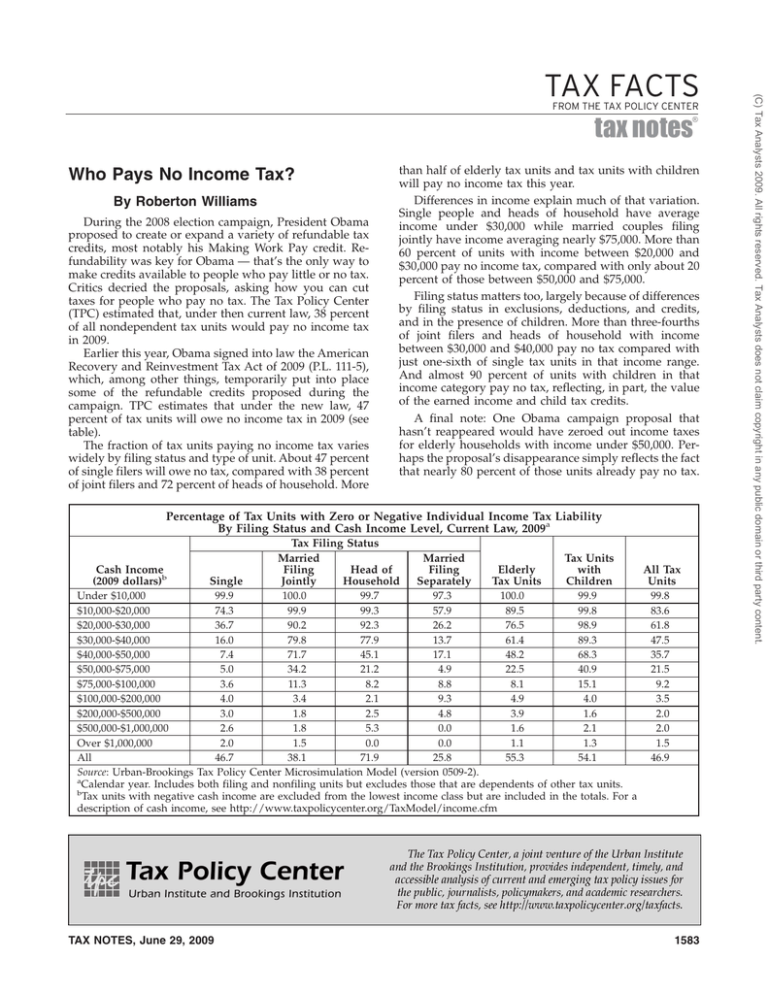
campaign. TPC estimates that under the new law, 47
percent of tax units will owe no income tax in 2009 (see
table).
The fraction of tax units paying no income tax varies
widely by filing status and type of unit. About 47 percent
of single filers will owe no tax, compared with 38 percent
of joint filers and 72 percent of heads of household. More
than half of elderly tax units and tax units with children
will pay no income tax this year.
Differences in income explain much of that variation.
Single people and heads of household have average
income under $30,000 while married couples filing
jointly have income averaging nearly $75,000. More than
60 percent of units with income between $20,000 and
$30,000 pay no income tax, compared with only about 20
percent of those between $50,000 and $75,000.
Filing status matters too, largely because of differences
by filing status in exclusions, deductions, and credits,
and in the presence of children. More than three-fourths
of joint filers and heads of household with income
between $30,000 and $40,000 pay no tax compared with
just one-sixth of single tax units in that income range.
And almost 90 percent of units with children in that
income category pay no tax, reflecting, in part, the value
of the earned income and child tax credits.
A final note: One Obama campaign proposal that
hasn’t reappeared would have zeroed out income taxes
for elderly households with income under $50,000. Perhaps the proposal’s disappearance simply reflects the fact
that nearly 80 percent of those units already pay no tax.
Percentage of Tax Units with Zero or Negative Individual Income Tax Liability
By Filing Status and Cash Income Level, Current Law, 2009a
Cash Income
(2009 dollars)b
Single
Tax Filing Status
Married
Filing
Head of
Jointly
Household
Married
Filing
Separately
Elderly
Tax Units
Tax Units
with
Children
Under $10,000
99.9
100.0
99.7
97.3
100.0
99.9
$10,000-$20,000
74.3
99.9
99.3
57.9
89.5
99.8
$20,000-$30,000
36.7
90.2
92.3
26.2
76.5
98.9
$30,000-$40,000
16.0
79.8
77.9
13.7
61.4
89.3
$40,000-$50,000
7.4
71.7
45.1
17.1
48.2
68.3
$50,000-$75,000
5.0
34.2
21.2
4.9
22.5
40.9
$75,000-$100,000
3.6
11.3
8.2
8.8
8.1
15.1
$100,000-$200,000
4.0
3.4
2.1
9.3
4.9
4.0
$200,000-$500,000
3.0
1.8
2.5
4.8
3.9
1.6
$500,000-$1,000,000
2.6
1.8
5.3
0.0
1.6
2.1
Over $1,000,000
2.0
1.5
0.0
0.0
1.1
1.3
All
46.7
38.1
71.9
25.8
55.3
54.1
Source: Urban-Brookings Tax Policy Center Microsimulation Model (version 0509-2).
a
Calendar year. Includes both filing and nonfiling units but excludes those that are dependents of other tax units.
b
Tax units with negative cash income are excluded from the lowest income class but are included in the totals. For a
description of cash income, see http://www.taxpolicycenter.org/TaxModel/income.cfm
TAX NOTES, June 29, 2009
All Tax
Units
99.8
83.6
61.8
47.5
35.7
21.5
9.2
3.5
2.0
2.0
1.5
46.9
1583
(C) Tax Analysts 2009. All rights reserved. Tax Analysts does not claim copyright in any public domain or third party content.
TAX FACTS


