ARTISTS' CONSTRUCTS A D +
advertisement
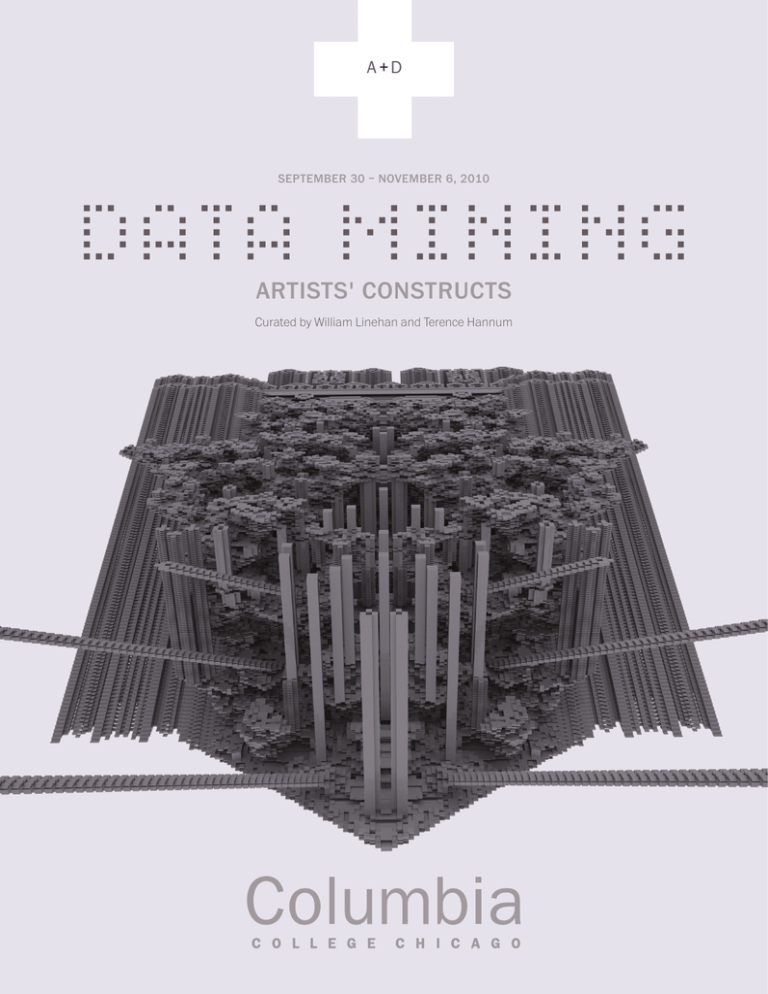
A +D SEPTEMBER 30 – NOVEMBER 6, 2010 ARTISTS' CONSTRUCTS Curated by William Linehan and Terence Hannum Sean Dack, Glitch#12, 2007 Cibachrome print 30 x 40 inches THE NEW BY WILLIAM LINEHAN THE TOWER BABEL (Genesis 11:1–11) a tower built by Noah's descendants (probably in Babylon) who intended it to reach up to heaven; God foiled them by confusing their language so they could no longer understand one another. Chicago. Summer 2010. It is 7:00 PM, twilight. Having eaten and come down from the day’s grind I open my window gazing out into a sea of other windows only to see framed within each another guy or a gal like me ensconced in front of an electronic window—a computer display—a small window within a larger window ad infinitum. It is a scene from an Edward Hopper painting gone testosterone. Twitter, Facebook, YouTube, Bing, Bliticky, BLOGidy, blah. Social media has made it seem normal, if not de rigueur, to share everything. We are filling up our data chalices and sending the unfermented data concoctions out into the night electron stream. Where does it go? In our hunger, our thirst to transcribe our personal data, we can’t afford to stop by the banks of this data stream, and siphon its teas leaves to measure its meaning. This night, as last night, and yesterday, last week, last month, the stream runs full. This Tower of Data, a virtual 21st century Babelian knock-off, continues its winding, spiraling ascent into the heavens. Facebook, Twitter, MySpace corporate coffers are spilling over. Heaven is a concoction. How much data. While social media is just one spigot filling the endless data streams each day, imagine adding other data outlets given the incredibly fast absorption of the Internet and Web into our social fabric. (Flashback to 1993. Marc Andreessen from University of Illinois and his decision to distribute Mosaic for free via the Internet.) The numbers are out of science fiction. Big numbers—really big numbers—here are a couple: Google processes 20 petabytes of data per day. That is, 20,000,000,000,000,000 bytes every day. There are close to 1.734 billion Internet users across the world. The news this summer was ablaze with the numbers and statistic of the likes of Facebook and Google (Facebook and Google getting egg in their respective faces on the ‘right to privacy’ issue). Who knew in such a short span Facebook would be at 400 million users and holding (the government perhaps with its appetite for data unquenchable). Who cares Enter the Outliers—a band of habitual, maladaptive and compulsive data purveyors. They come from backgrounds as diverse as Sociology, Anthropology, Computer Science, Fine Arts, Communication Design, Multimedia. Their ability to forage into this new landscape, data fields, is because of the unabated strides in information technologies vis-à-vis the computer in the last 20 years. The famous computer adage circa 1965, ‘Moore’s law states that the chip (computer brain) keeps doubling every 18 months’, keeps creeping back into the conversation. Add to the doubling continuum in computational power, the new sophistication with software and code and you have this observation by Lev Manovich, exhibitor and lecturer: “We are a new period we are living in now. It is a period when more prosaic but ultimately more consequential ways of exploring data have come to the forefront, including search engines available to the masses and data mining as used by companies and government agencies.” (Lev Manovich, from introduction to Tate Exhibition, 2002). Empowered by technological advances and an artist’s inquisitive and challenging nature (not readily accepting of social norms and conveyances) these Outliers forage through heaps and piles and clutter of data– the disassembled bricks and mortar of our perpetual 21st century Tower of Babel– and then siphon off associations, relevance’s, ‘‘algebraical patterns” as Charles Babbage’s (of Analytic Engine fame) assistant, Ada Augusta, coined n 1883. They use quantification over emotion to distill a reasoned patterning within the numbers. This is their passion. The irony being, as witnessed in the exhibition Data Mining /Artists' Constructs, this ostensibly dry, mechanical type of process yields gems of insight and circumspection about us the windows gazers and data streamers. A language reemerges, a connectivity. The Dataists, when their numbers and algorithms align, reveal patterns that become windows into ourselves in a broader context of societal meaning and being. THE OUTLIERS Golin Levin (working with Kamal Nigam and Jonathan Feinberg) created a seminal visualization/data mining piece, The Dumpster, in 2006. This was co-produced by Whitney Artport, the Whitney Museum Portal to Net Art. It was if an outlier flag had been raised at the base of this imploding 21st century rumbling tower of data with the imprint, ‘I see a pattern’. The Dumpster literally forages through the bottom most pit of human frailty: early lost love– adolescent breakups. (Most instances on this site are between the ages of 13 and 19). These breakups were obtained from web logs Lev Manovich, 1074790 Manga pages, 2010, Custom and open source software, 1 million Manga pages Mark Napier, Pam Standing, 2009, Custom software Image courtesy bitforms gallery nyc Lynn Hershman, Synthia, 2000–2003. Custom software, dimensions variable Image courtesy bitforms gallery nyc Andreas Kratky and Juri Hwang, Venture to the Interior, 2010. Computer based interactive installation, dimensions variable Golin Levin (with Kamal Nigam and Jonathan Feinberg), The Dumpster, 2006, Interactive online information visualization, dimensions variable Collection of Whitney Artport, the Whitney Museum Portal to Net Art, Image courtesy bitforms gallery nyc ("blogs") posted by people on the Internet, thousands of them. Levin and Nigam’s piece with its probing, sophisticated data collecting embodied in an almost browser like interface allows for both an analytic and/ or emotional read on data. We are allowed to navigate between the profound (and not so profound) details of young love coming undone. What is of interest here is that data collected for The Dumpster didn’t come out of a university’s psychology department, government funded study. It is in a real way, ‘raw’ data, made possible by the Web—there for an outliers pickings. A side note. Social media hit our cultural and sociological shores with tsunami like force in the past 5 years. Facebook, the powerhouse social media site and rite of passage for these same 13 to 19 year olds that Levin seemed to have targeted in his piece, was bandied about in Harvard dorm rooms in 2004. It was not the monster in 2006 it has become now but it was a beacon starting to illuminate in the cultural landscape. (Witness March of this year, 2010, where more people visited Facebook than Google.) The success, in part, of Levin and Nigam piece is that that they saw this early on. Lynn Hershman’s piece, Synthia, again is an earlier piece in this genre of appropriation and incorporation of database into an art visualization/manifestation. In the original piece, a multimedia sculpture (a video adaptation is on view in this show), the character Synthia is displayed on a plasma screen under a bell glass of an electronic ticker tape inspired by Thomas Edison’s design. The character does sort of a psychological gyration to the fluctuations of the stock market, which is being projected by the modern stock ticker across the screen (replacing Edison’s ticker tape and telegraph). Hershman’s character’s moods are a soap opera-ish mirroring of the pulse of the stock market at a particular moment. It is a kind of eerie proxy of us. Who can avoid the ubiquitous stock sticker with its 24/7 data stream? Is imbedded in our social landscape, and our pulses do go up and down with its gyration. Two artists/outliers in the show, Lev Manovich and Mark Napier, take a different twist on social forms via their database/algorithm art constructs. They both start their point of inquiry/attack using establish cultural beacons but their process and revelations are quite different. of a game changer in how we shed light on ourselves, define our cultural and social identities. One might read between the lines in his acclaimed book, The Language of New Media, seeing an argument that the computer, an important and often under weighted cog in the discourse on aesthetics and meaning, has usurped ‘the traditional Arts’ as a more legitimate tool for approaching and revealing cultural interpretation and aesthetic reasoning for a radically new society coming to the for. Mark Napier, Pam Standing “is a new-media Venus: a body re-formed from fragments scattered across the Web. This generative screen-based work is a mash-up of hundreds of images of Pamela Anderson downloaded from the Internet”. With Pam Standing, Napier utilizes algorithm pulls and levers, to awaken and rattle a media flavored version of our unconscious sexual selves. He has engineered a Mixmaster blender with his motion collage snippets of Pamela that has a perverse Freudian cum Marshall McLuhan colorization. Pamela, herself willfully reconstituted via breast enhancement, is re-appropriated—more like counterhegemonic re-purposed—in Napier’s piece to deliver a moving shrine (blender) to the persistence of media and its stereotypical shaping of cultural icons. Two artists whose work is highly processed or generative are Sean Dack and Paul Slocum. Sean Dack’s, Glitch series, is a generative piece but the image’s final resting place is a highly distorted, digital image showing mere traces of the original. Stop motion of a digital stream? We extrapolate to build the image in our mind and unfold the story. Paul Slocum created Pi House Generator, which uses software to randomly generate house music using the number pi. As explained on his website, ‘the software progressively calculates the sequence of digits in pi, starting at 3.14 and progressing towards infinity’. The music, randomly generated and structured by Paul’s music generator, becomes infinitely long and static. It will finally degenerate as the computer processor runs out of gas trying to keep up with the cyclical revolutions of the calculating pi engine. Lev Manovich pulls data from a well-used cultural icon, the Manga page, and uses the data analysis of their construction and stylization to write algorithmic rules to generate a massive display—1 million Manga pages to be exact—which in its density, concentration and patterning approaches an astronomical star cluster. Here with the shower of Manga images plotted to some grey scale coefficient he makes an interesting twist on looking at and understanding us vis-à-vis our cultural artifacts. Try to do that with natural language means. The Manga page becomes the proxy for shaking out another order of cultural associations circa the millennium generation. R. Luke DuBois’ piece, cleverly named, Hindsight is Always 20/20, plays off the weird connect between language and vision. One can’t help but refer back to Manovich’s epistle, The Language of New Media, in which he extols, “Therefore visualization is a better language for describing cultural variability than natural languages”. Here we have both, text and image being orchestrated. DuBois puts on the hard hat of the forager and dataist and devises an artist’s construct, the eye chart for the interplay between both. His piece is a metaphor about political vision and measure. Can one get at the psyche of the nation by filtering The State of the Union message– he sorts each and every State of the Union speech according to word frequency, generating a Snellen Eye Chart for each president through the filter of words most utilized by that president in composing their address. DuBois, offers us a gem of a metaphor hoping to get at our reoccurring State of the National Psyche. Manovich, somewhat the Mad Hatter of New Media and Data Visualization world, argues adroitly for computers and their analytic capabilities being more Stephen Cartwright, the consummate dataist has since 1999 recorded his exact latitude, longitude and elevation every hour of every day. His current series, “Lost Landscape”, marries his fidelity to topological data to current digital fabrication techniques to translate his collected data into his sculptural projects. He came upon digital fabrication techniques while working in the exhibit industry, making displays and prototypes. His installation in the exhibition, Fort Peck, uses cast, acrylic pieces from digital fabrication to reflect accurately topographic formations that have been massively altered by human intervention. Fort Peck depicts a former valley that is now flooded by impounded Missouri River water. This piece is a meditation on human alteration of the natural landscape. Finally, Andreas Kratky and Juri Hwang, and their very ambitious installation, museum as a datacollection, Venture to the Interior, was commissioned in conjunction with the Natural History Museum in Berlin, Germany, where it is being premiered to the public simultaneously with its showing at Columbia College Chicago. Their piece is a navigable, virtual museum space presented in a stereoscopic 3D projection. Their piece reflects the tension inherent in cumulative knowledge construction—the wherewithal of a museum and its collection of static objects—and the persistence of knowledge, which is not fixed, but a transmutable entity which ebbs and flows from culture and generational mind sets. Kratky and Hwang are comfortable crossing the bridge between the Fine Arts, keyed to reflection, and Design, driven to implementation and the utilitarian. Venture to the Interior harnesses the power of data collection and structured and informed delivery of that data to further augment and evolve the role of the museum as a knowledge gatherer. If anything, Kratky and Hwang’s work for the Natural History Museum in Berlin is a harbinger of the greater role that will be played by artists and designers in our now rapidly unfolding global village of this, the 21st century. These folks will be working in part with, and harnessing, powerful informational portals to reveal ‘patterns and windows into our evolving selves’. Not only will the goal be reflection but also as steerage, to help us navigate our new century that teeters precariously on a precipice wrought by economic and/ or ecological mismanagement and greed. William Linehan is an Associate Professor in Graphic Design at Columbia College Chicago’s School of Fine and Performing Arts. He has worked as a design consultant for clients in medical, pharmaceutical, publishing, advertising, higher ed, and performing arts fields. Prior to opening his own design consultancy business, Linehan worked as a designer in corporate communications and creative services for R. R. Donnelley & Co. and Arthur Andersen & Co. Recent exhibitions include ‘Art From The Heartland’, Indianapolis Art Museum, March 2010 and Creative Quarterly, online gallery, Issue 20, Fall 2010. He is represented in artist books collections at The Museum of Modern Art / Franklin Furnace; The Museum of Cotemporary Art; Joan Flasch Artists' Book Collection / The School of The Art Institute of Chicago. R. Luke DuBois, Hindsight is Always 20/20, 2008, Installation view, set of 43 letterpress prints, 41 eye charts, 1 title, 1 synopsis, 21.25 x 28.25 inches each, Image courtesy bitforms gallery nyc A+D art +design AVERILL AND BERNARD LEVITON A+D GALLERY 619 SOUTH WABASH AVENUE CHICAGO, ILLINOIS 60605 312 369 8687 COLUM.EDU/ADGALLERY GALLERY HOURS TUESDAY – SATURDAY 11AM – 5PM THURSDAY 11AM – 8PM Stephen Cartwright, Fort Peck, 2009, Acrylic, 13 x 8 x 2 feet This exhibition is sponsored by the Art + Design Department at Columbia College Chicago. This exhibition is partially supported by a grant from the Illinois Arts Council, a state agency, and by the Efroymson Family Fund, a CICF Fund. PRINTED ON PAPER WITH 10% POST CONSUMER CONTENT. FRONT: Paul Slocum, Conway’s Game of Life Extrusion, 2010, digital print from custom software, 24 x 36 inches
