Additional Graphing Exercises Using Excel
advertisement
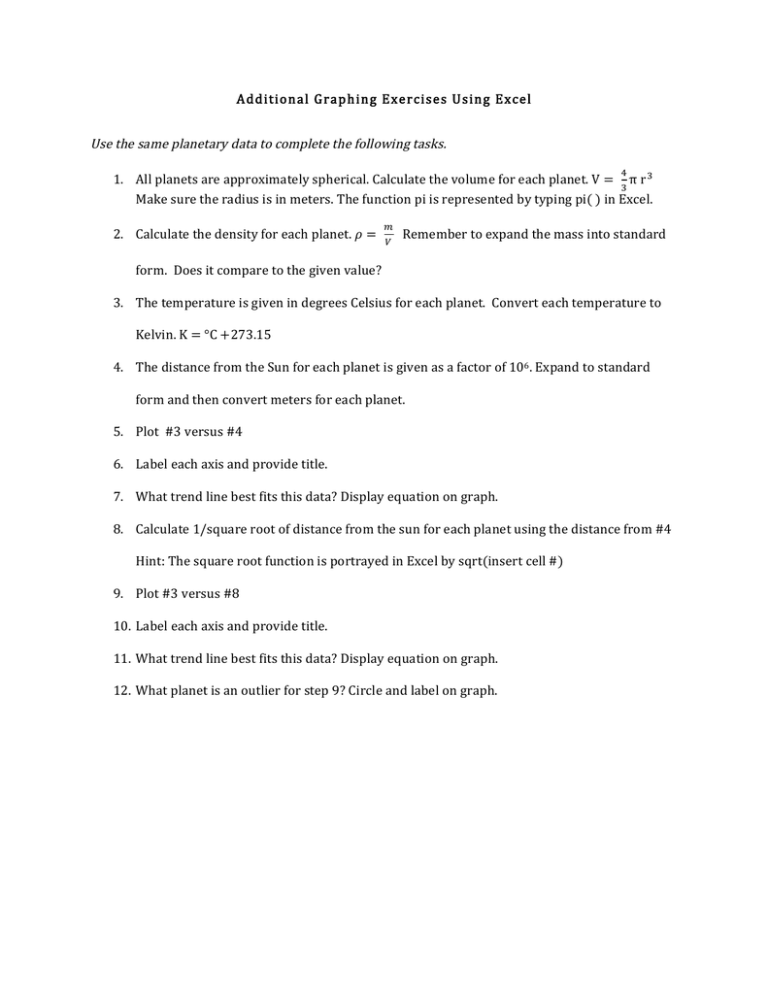
Additional Graphing Exercises Using Excel Use the same planetary data to complete the following tasks. ! 1. All planets are approximately spherical. Calculate the volume for each planet. V = π r ! ! Make sure the radius is in meters. The function pi is represented by typing pi( ) in Excel. ! 2. Calculate the density for each planet. 𝜌 = Remember to expand the mass into standard ! form. Does it compare to the given value? 3. The temperature is given in degrees Celsius for each planet. Convert each temperature to Kelvin. K = °C +273.15 4. The distance from the Sun for each planet is given as a factor of 106. Expand to standard form and then convert meters for each planet. 5. Plot #3 versus #4 6. Label each axis and provide title. 7. What trend line best fits this data? Display equation on graph. 8. Calculate 1/square root of distance from the sun for each planet using the distance from #4 Hint: The square root function is portrayed in Excel by sqrt(insert cell #) 9. Plot #3 versus #8 10. Label each axis and provide title. 11. What trend line best fits this data? Display equation on graph. 12. What planet is an outlier for step 9? Circle and label on graph.
