THE SUNSPOT CYCLE ... Listed below are the annual sunspot data for the last...
advertisement
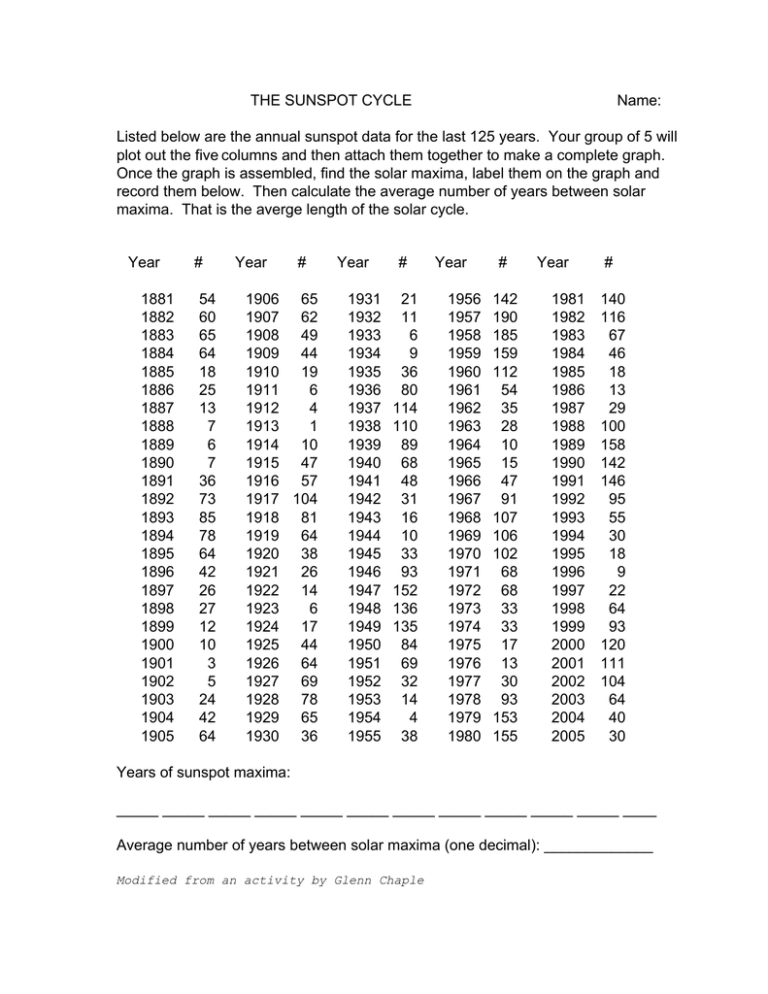
THE SUNSPOT CYCLE Name: Listed below are the annual sunspot data for the last 125 years. Your group of 5 will plot out the five columns and then attach them together to make a complete graph. Once the graph is assembled, find the solar maxima, label them on the graph and record them below. Then calculate the average number of years between solar maxima. That is the averge length of the solar cycle. Year 1881 1882 1883 1884 1885 1886 1887 1888 1889 1890 1891 1892 1893 1894 1895 1896 1897 1898 1899 1900 1901 1902 1903 1904 1905 # 54 60 65 64 18 25 13 7 6 7 36 73 85 78 64 42 26 27 12 10 3 5 24 42 64 Year # 1906 65 1907 62 1908 49 1909 44 1910 19 1911 6 1912 4 1913 1 1914 10 1915 47 1916 57 1917 104 1918 81 1919 64 1920 38 1921 26 1922 14 1923 6 1924 17 1925 44 1926 64 1927 69 1928 78 1929 65 1930 36 Year 1931 1932 1933 1934 1935 1936 1937 1938 1939 1940 1941 1942 1943 1944 1945 1946 1947 1948 1949 1950 1951 1952 1953 1954 1955 # 21 11 6 9 36 80 114 110 89 68 48 31 16 10 33 93 152 136 135 84 69 32 14 4 38 Year 1956 1957 1958 1959 1960 1961 1962 1963 1964 1965 1966 1967 1968 1969 1970 1971 1972 1973 1974 1975 1976 1977 1978 1979 1980 # 142 190 185 159 112 54 35 28 10 15 47 91 107 106 102 68 68 33 33 17 13 30 93 153 155 Year 1981 1982 1983 1984 1985 1986 1987 1988 1989 1990 1991 1992 1993 1994 1995 1996 1997 1998 1999 2000 2001 2002 2003 2004 2005 # 140 116 67 46 18 13 29 100 158 142 146 95 55 30 18 9 22 64 93 120 111 104 64 40 30 Years of sunspot maxima: _____ _____ _____ _____ _____ _____ _____ _____ _____ _____ _____ ____ Average number of years between solar maxima (one decimal): _____________ Modified from an activity by Glenn Chaple

![Indrani Roy and Joanna D. Haigh [], Imperial College, London,... Solar Cycle Signals in Sea Level Pressure and Sea Surface... We identify solar cycle signals in 155 years of global...](http://s2.studylib.net/store/data/013086513_1-8ad6c63d9d7c2f125a3f0195d380c96d-300x300.png)

