PHOTOACOUSTIC TOMOGRAPHY: Credits to Lab Members High-resolution Imaging of Optical
advertisement

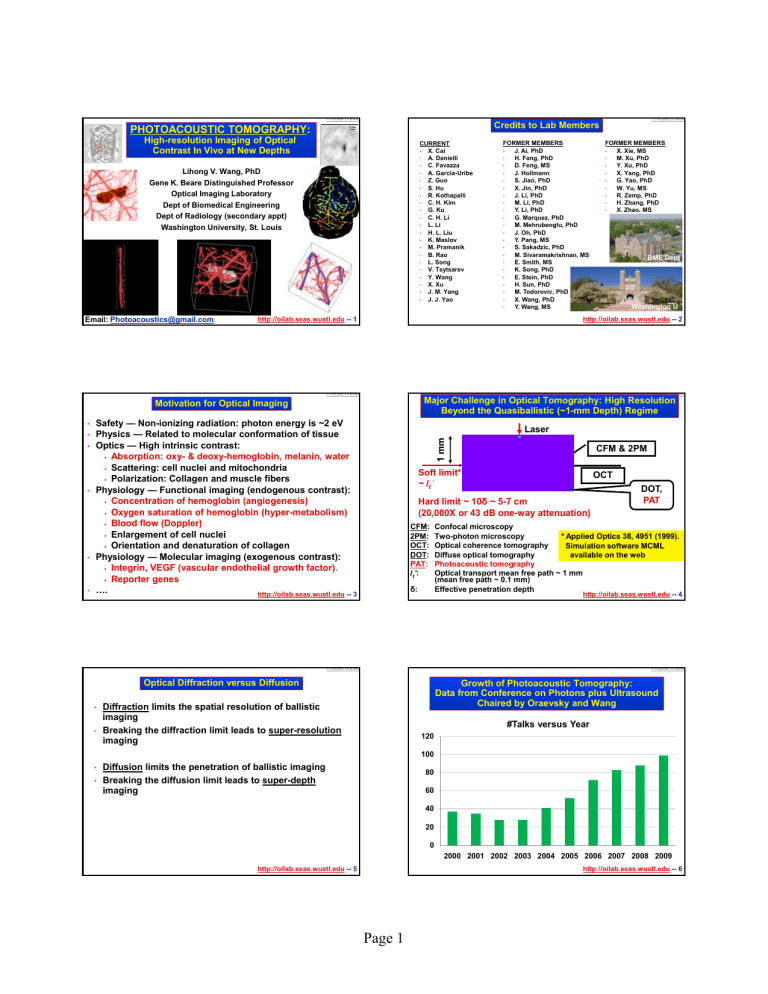
© 7/16/2009, LV WANG PHOTOACOUSTIC TOMOGRAPHY: High-resolution Imaging of Optical Contrast In Vivo at New Depths CURRENT • X. Cai • A. Danielli • C. Favazza • A. Garcia-Uribe • Z. Guo • S. Hu • R. Kothapalli • C. H. Kim • G. Ku • C. H. Li • L. Li • H. L. Liu • K. Maslov • M. Pramanik • B. Rao • L. Song • V. Tsytsarev • Y. Wang • X. Xu • J. M. Yang • J. J. Yao Lihong V. Wang, PhD Gene K. Beare Distinguished Professor Optical Imaging Laboratory Dept of Biomedical Engineering Dept of Radiology (secondary appt) Washington University, St. Louis Email: Photoacoustics@gmail.com • • • • • Washington U © 7/16/2009, LV WANG Laser CFM & 2PM Soft limit* ~ lt’ OCT Hard limit ~ 10δ ~ 5-7 cm (20,000X or 43 dB one-way attenuation) CFM: 2PM: OCT: DOT: PAT: lt’: δ: DOT, PAT Confocal microscopy Two-photon microscopy * Applied Optics 38, 4951 (1999). Optical coherence tomography Simulation software MCML Diffuse optical tomography available on the web Photoacoustic tomography Optical transport mean free path ~ 1 mm (mean free path ~ 0.1 mm) Effective penetration depth http://oilab.seas.wustl.edu -- 4 © 7/16/2009, LV WANG © 7/16/2009, LV WANG Optical Diffraction versus Diffusion • BME Dept Major Challenge in Optical Tomography: High Resolution Beyond the Quasiballistic (~1-mm Depth) Regime Safety — Non-ionizing radiation: photon energy is ~2 eV Physics — Related to molecular conformation of tissue Optics — High intrinsic contrast: Absorption: oxy- & deoxy-hemoglobin, melanin, water Scattering: cell nuclei and mitochondria Polarization: Collagen and muscle fibers Physiology — Functional imaging (endogenous contrast): Concentration of hemoglobin (angiogenesis) Oxygen saturation of hemoglobin (hyper-metabolism) Blood flow (Doppler) Enlargement of cell nuclei Orientation and denaturation of collagen Physiology — Molecular imaging (exogenous contrast): Integrin, VEGF (vascular endothelial growth factor). Reporter genes …. http://oilab.seas.wustl.edu -- 3 • FORMER MEMBERS • X. Xie, MS • M. Xu, PhD • Y. Xu, PhD • X. Yang, PhD • G. Yao, PhD • W. Yu, MS • R. Zemp, PhD • H. Zhang, PhD • X. Zhao, MS http://oilab.seas.wustl.edu -- 2 © 7/16/2009, LV WANG • FORMER MEMBERS J. Ai, PhD H. Fang, PhD • D. Feng, MS • J. Hollmann • S. Jiao, PhD • X. Jin, PhD • J. Li, PhD • M. Li, PhD • Y. Li, PhD • G. Marquez, PhD • M. Mehrubeoglu, PhD • J. Oh, PhD • Y. Pang, MS • S. Sakadzic, PhD • M. Sivaramakrishnan, MS • E. Smith, MS • K. Song, PhD • E. Stein, PhD • H. Sun, PhD • M. Todorovic, PhD • X. Wang, PhD • Y. Wang, MS • http://oilab.seas.wustl.edu -- 1 Motivation for Optical Imaging • © 7/16/2009, LV WANG Credits to Lab Members 1 cm Growth of Photoacoustic Tomography: Data from Conference on Photons plus Ultrasound Chaired by Oraevsky and Wang Diffraction limits the spatial resolution of ballistic imaging Breaking the diffraction limit leads to super-resolution imaging #Talks versus Year 120 100 • • Diffusion limits the p penetration of ballistic imaging g g Breaking the diffusion limit leads to super-depth imaging 80 60 40 20 0 2000 2001 2002 2003 2004 2005 2006 2007 2008 2009 http://oilab.seas.wustl.edu -- 5 http://oilab.seas.wustl.edu -- 6 Page 1 © 7/16/2009, LV WANG © 7/16/2009, LV WANG Solutions for High-resolution Optical Imaging in Tissue (a) Diffuse light out Alexander G. Bell’s Photophone Based on Photoacoustics Photoacoustic effect: 1 Light absorption 1. 2. Temperature rise 3. Thermoelastic expansion 4. Acoustic emission (b) Clear light out (invasive surgery) (c) Clear light out (toxic optical clearing) [1] A. G. Bell, “On the production and reproduction of sound by light,” American J. of Science, vol. 20, pp. 305-324, 1880. [2] “Production of sound by radiant energy,” Manufacturer and Builder, vol. 13, pp. 156-158, 1881. http://oilab.seas.wustl.edu -- 8 (d) Clear sound out (photoacoustic conversion) http://oilab.seas.wustl.edu -- 7 © 7/16/2009, LV WANG © 7/16/2009, LV WANG Photoacoustic Computed Tomography Spherical Radon Transform and Spherical Backprojection Detection surface (1) Laser pulse (<ANSI limit: e.g., 20 mJ/cm2) (2) Light absorption & heating (~ mK) r 2 p0 ( r ) = Ω0 r r ∫ [ p(r , t ) − t∂p(r , t ) / ∂t ] 0 0 Beamforming Optical contrast http://oilab.seas.wustl.edu -- 9 © 7/16/2009, LV WANG 1.5 80% 1.0 1 1.0 1 0.5 0.5 Min 1.5 2.0 (cm) Differential absorption Max Nature Biotech. 21, 803 (2003). 0 Min 0.5 1.0 1.5 2.0 (cm) Differential absorption Max 20% Structural resolution: 60 μm Speckle free 0 0 1 mm 1.0 Delay http://oilab.seas.wustl.edu -- 10 (b) Molecular imaging: Tumor over-expression of integrin Max Hemoglob bin oxygen saturatio on (SO2) (cm) 2.0 (cm) 2.0 1.5 (a) Functional imaging: Tumor hypoxia Right-whisker stimulation 40% 0.5 dΩ 0 © 7/16/2009, LV WANG 60% 0 High-frequency r r t = r − r0 vs Functional and Molecular Photoacoustic Imaging: Nude Mouse with a U87 Glioblastoma Xenograft in the Brain Transcranial Functional Photoacoustic Imaging of Rat Whisker Stimulation In Vivo: Hemodynamics Left-whisker stimulation Physical Review E 71 016706 (2005). 71, (2005) Physical Rev. Lett. 92, 033902 (2004). Backprojection for planar, cylindrical, and spherical detection surfaces (Ω 0 : Solid angle ) : (3) Ultrasonic emission (~ mbar) 1 mK Æ 8 mbar = 800 Pa Nature Biotech. 21, 803 (2003). Object vs t Proc. of IEEE 96, 481, 2008. * Contrast agent provided by Chun Li’s Group (MD Anderson) http://oilab.seas.wustl.edu -- 11 Page 2 Molecula ar contrast (IRDye800 0 + peptide) (4) Ultrasonic detection (optical scatter/100) Integration sphere Min Resolution: 312 μm Sensitivity: 4 fmol/voxel (40 nM) http://oilab.seas.wustl.edu -- 12 © 7/16/2009, LV WANG © 7/16/2009, LV WANG 5-MHz Ring Ultrasonic Array • • • • Noninvasive Photoacoustic Image of a Mouse Brain: 360o View, 0.9 Hz Frame Rate and Gel Coupling Transducers: Elements: 512-elements. Center frequency: 5 MHz. Bandwidth: 80% of center freq. Geometry: Shape: Ring with 50 mm diam. Pitch: 0.308 mm. Kerf: 0.1 mm. Elevation height: 10 mm. Elevation focal length: 19 mm mm. Data acquisition: Channels: 64 channels A/D (8:1 MUX) Sampling rate: 40 MHz. Sampling dynamic range: 12 bits. Frame rate: 0.9 Hz with a 7-Hz laser pulse repetition. Resolution: J. Biomed. Optics 13, 024007, 2008. In plane: ~200 µm. Optics Express, submitted, 2009. Elevation: ~1.9 mm. * Detection system by Q. Zhu’s Group (UConn). Photoacoustic Image Field of view: 10 mm x 14 mm C. Li et al., unpublished. http://oilab.seas.wustl.edu -- 13 Photograph http://oilab.seas.wustl.edu -- 14 © 7/16/2009, LV WANG © 7/16/2009, LV WANG Reflection-mode Dark-field Confocal Photoacoustic Microscopy: System Reflection-mode Photoacoustic Microscopy: Illustration x Surface Tunable laser z y B-scan Photodiode Motor driver Translation stages Target Nd:YAG pump laser Optical illumination Amplifier Ultrasonic transducer Conical lens AD Photoacoustic signal Sample holder Optical absorption Time of arrival or depth Mirror Computer Base Heater & Dual foci temperature controller A-scan Optics Letters 30, 625 (2005). Nature Biotech. 24, 848 (2006). Nature Protocols 2, 797 (2007). http://oilab.seas.wustl.edu -- 15 Sample http://oilab.seas.wustl.edu -- 16 © 7/16/2009, LV WANG © 7/16/2009, LV WANG Photoacoustic Imaging Depth and Resolution: 50 MHz System (High Ultrasonic Frequency) 3 mm m B-scan of a doublestranded cotton thread embedded in a rat Surface Thread Super-depths for highresolution optical imaging (beyond the quasiballistic regime) Annular illumination with a dark center Volumetric Imaging of Rat Microvasculature In Vivo Maximum amplitude projection onto the skin • Imaging depth: ~3 mm • Axial resolution: ~15 microns • Depth/resolution: ~200 pixels • Lateral resolution: ~45 microns • Acquisition time: 2 µs/A-scan • Signal averaging: None 1 mm Optics Letters 30, 625 (2005). Volume: 10 mm x 8 mm x 3 mm Optics Express 14, 9317 (2006). http://oilab.seas.wustl.edu -- 17 Page 3 http://oilab.seas.wustl.edu -- 18 © 7/16/2009, LV WANG Concentration Acute thermal (175 oC, 20 s) burn in pig skin in vivo. Postmortem imaging at 584-nm optical wavelength. Burn depth ~1.7 mm Oxygenation versus physiological state Hyperemic bowl 0.1 Skin surface 0 Hyperemic bowl J. Biomed. Optics 11, 054033 (2006). 5.5 6 6.5 7 7.5 Distance [mm] 8 http://oilab.seas.wustl.edu -- 19 © 7/16/2009, LV WANG 1 Vein 0.8 0.6 Scalp • • 100 30 80 20 60 10 40 0 20 -10 0 J. Biomed. Optics 14, 020502 (2009). 10 20 30 Time (min) Melanoma 1 mm Melanoma Histology 0.5 mm 40 40 Melanoma Surface rendering 1 mm Movie % [O2] % Change in PA signa al (561/570 nm) • PAM used to track oxygenation of multiple cortical vessels Dual-wavelength images 561 nm (Hb-dominant) 570 nm (Isosbestic) Step changes in [O2] 100% and 5% Time resolution < 1 sec © 7/16/2009, LV WANG B-scan at 764 nm Photograph Melanoma • http://oilab.seas.wustl.edu -- 20 Composite photoacoustic image with 584 and 764 nm Enveloped BScan along line Cortical vessels Appl. Phys. Lett. 90, 053901 (2007). Photoacoustic Imaging of a Melanoma Tumor in a Small Animal In Vivo Photoacoustic Monitoring of Dynamic Brain Oxygenation 1mm 1 mm Artery Hyperoxia 0.2 Normoxia Histology PA amplitude [a.u.] 1 mm Arteries (red) & veins (blue) 1 mm Hyperemic y bowl 1 mm Hyperemic ring Oxygen saturation B-scan image Hypoxia Photoacoustic image Imaged oxygen saturation Photograph Healthy Coagulated tissue tissue © 7/16/2009, LV WANG Photoacoustic Imaging of Hemodynamics in a Small Animal In Vivo Photoacoustic Imaging of Skin Burn in Pigs Contrasts: Vessel: 13±1 Melanoma: 68±5 0 Skin surface x z y 8 mm Nature Biotech. 24, 848 (2006). http://oilab.seas.wustl.edu -- 21 3 mm 8 mm http://oilab.seas.wustl.edu -- 22 © 7/16/2009, LV WANG © 7/16/2009, LV WANG In Vivo Photoacoustic Molecular (Genetic) Imaging: Gene Expression in Gliosarcoma Tumor in Rat Photoacoustic Imaging of Extravasated Nanoshells Surrounding a Tumor in a Small Animal In Vivo 1. 2. 3. 4. LacZ (gene) Beta-galactosidase (enzyme ) X-gal (colorless substrate) Blue product Image of blood vessels at 584-nm wavelength Tumor Image of expression of LacZ reporter gene at 635nm wavelength Composite image 1 mm Nanoshells Nanoshells provided by Nanospectra J. Biomed. Optics 14, 010507 (2009). 1 mm J. Biomed. Optics 12, 020504 (2007). http://oilab.seas.wustl.edu -- 23 Page 4 http://oilab.seas.wustl.edu -- 24 © 7/16/2009, LV WANG © 7/16/2009, LV WANG Photoacoustic Imaging of Human Palm Photo Photoacoustic Imaging of Human Palm: African American Max amplitude projection @ 584 nm Photo B-Scan @ 584 nm B-Scan @ 584 nm C. Favazza, unpublished. C. Favazza, unpublished. http://oilab.seas.wustl.edu -- 25 http://oilab.seas.wustl.edu -- 26 © 7/16/2009, LV WANG © 7/16/2009, LV WANG Deeply Penetrating (30 mm) 5-MHz Photoacoustic Imaging System Transducer frequency: 5 MHz Optical wavelength: 804 nm Exposure: <31 mJ/cm2 (ANSI) Signal averaging: 30 times SAFT (synthetic-aperture f focusing i technique) t h i ) 30 mm 23 3mm 17 mm 30 0mm38 mm • Surface Tissue surface • • • • Horse Hairs hair In Vivo Photoacoustic Imaging of Sentinel Lymph Node in Rat with Methylene Blue (L15-7 Transducer) Photoacoustic: Before Injection • • 150 100 50 Rubber rubber Photoacoustic & Ultrasound 200 Axial resolution: 144 µm Transverse resolution: 560 µm SNR: 24 dB at 30 mm depth • Photoacoustic: After Injection 0 Field of view: 12 mm x 18 mm J. Biomed. Opt. 12, 060503 (2007). In collaboration with Philips, unpublished. Credit: C. Kim, T. Erpelding, L. Jankovic http://oilab.seas.wustl.edu -- 27 © 7/16/2009, LV WANG © 7/16/2009, LV WANG Optical Resolution Photoacoustic Microscopy of Angiogenesis in a Nude Mouse: 5 Micron Lateral Resolution Photoacoustic Imaging of Sentinel Lymph Node in Rat at 2 cm Depth (S5-1 transducer, no averaging) Pre-Injection Methylene Blue http://oilab.seas.wustl.edu -- 28 Post-Injection Methylene Blue ∼2cm turkey breast Average depth of human axillary lymph nodes = 1.2 cm Each image: 4.00x1.00x0.45 mm3 http://oilab.seas.wustl.edu -- 29 Page 5 S. Hu et al., unpublished (Collaboration: Arbeit). http://oilab.seas.wustl.edu -- 30 © 7/16/2009, LV WANG © 7/16/2009, LV WANG Optical Resolution Photoacoustic Microscopy of Single Red Blood Cells In Situ: 2 Micron Lateral Resolution Photoacoustic Endoscopy JB UST OF MN N S SM S N GM PM 100 µm 0° 250° SW PM J. Yang et al., Optics Letters, 34, 1591(2009). G. Ku et al., unpublished. http://oilab.seas.wustl.edu -- 31 http://oilab.seas.wustl.edu -- 32 © 7/16/2009, LV WANG © 7/16/2009, LV WANG Microwave-induced Thermoacoustic Tomography (TAT): Experimental System and Image of Mastectomy Specimen Water tank Ultrasonic transducers Summary • Step motor • 1 cm • Waveguide Microwave: • 3 GHz frequency • 500 ns pulse width Amplifiers • ~5 mJ pulse energy • 9 cm penetration in fat Oscilloscope Tech. in Cancer Res. & Treat. 4, 559 (2005). • Invasive lobular carcinoma • 11 cm diameter X 9 cm thick • 5:1 contrast • http://oilab.seas.wustl.edu -- 33 Photoacoustic tomography achieved by optical excitation and ultrasonic detection: Physically integrated single modality. Depths beyond optical transport mean free path imaged Absorption of both unscattered and scattered photons used “Soft limit” (~1 mm in skin) broken (i.e., superdepths achieved) “Hard limit” (~5 cm) reached Spatial p resolution at superdepths p p determined ultrasonically y Number of resolvable pixels enhanced: Depth/resolution > 200 Depth and resolution scaled: Scalable multiscale imaging 15 micron axial resolution at 3 mm depth shown 150 micron axial resolution at 30 mm depth shown Spatial resolution within “soft limit” determined both optically and ultrasonically 2-5 micron transverse resolution demonstrated Single capillaries (smallest blood vessels) resolved Single red blood cells imaged http://oilab.seas.wustl.edu -- 34 © 7/16/2009, LV WANG © 7/16/2009, LV WANG Summary (Continued) • • Summary (Continued) Contrast provided by optical absorption properties Ultrasonic or fluorescent contrasts complemented Sensitivity to specific absorption (mJ/cc) shown to be 100% High specificity attributed to high intrinsic contrast: Blood:bg>10:1 Multiple chromophores detected spectrally: Oxy- and deoxy-Hb Functional imaging allowed by endogenous chromophores: sO2 Molecular biomarker imaging enabled by targeted contrast agents: Organic IRDye800 bound to integrin Molecular gene-expression imaging derived from reporter genes: Blue product from lacZ gene Frame rate limited theoretically by range/sound speed: 0.1 ms Æ 15 cm 50 frames/second (Hz) achieved thus far Limited practically by the number of ultrasonic transducers Limited practically by the pulse repetition rate of the laser • • • • http://oilab.seas.wustl.edu -- 35 Thermoacoustic tomography achieved by microwave/RF excitation and ultrasonic detection. Optical “hard limit” broken Water or ion contrasts imaged Deep-penetrating nonionizing molecular imaging possible Speckle in optical coherence tomography or ultrasonography avoided Non-ionizing radiation used Costs estimated comparable to those of ultrasound imaging systems http://oilab.seas.wustl.edu -- 36 Page 6 Source codes 2007 Chapters 1. 2. 3. 4. 5. 6. 7 7. 8. 9. 10. 11. 12. 13. © 7/16/2009, LV WANG © 7/16/2009, LV WANG Introduction to biomedical optics Single scattering: Rayleigh theory and Mie theory Monte Carlo modeling of photon transport Convolution for broad-beam responses Radiative transfer equation and diffusion theory Hybrid model of Monte Carlo method and diffusion theory Sensing of optical properties and spectroscopy Ballistic imaging and microscopy Optical coherence tomography Mueller optical coherence tomography Diffuse optical tomography Photoacoustic tomography Ultrasound-modulated optical tomography • JOB OPENINGS: Postdoctoral and predoctoral openings available Please visit our web at http://oilab.seas.wustl. edu Homework solutions provided for instructors Taped tech presentations available on our web http://oilab.seas.wustl.edu -- 37 http://oilab.seas.wustl.edu -- 38 Page 7


