Mott Community College General Fund Balance Sheet September 30, 2006
advertisement
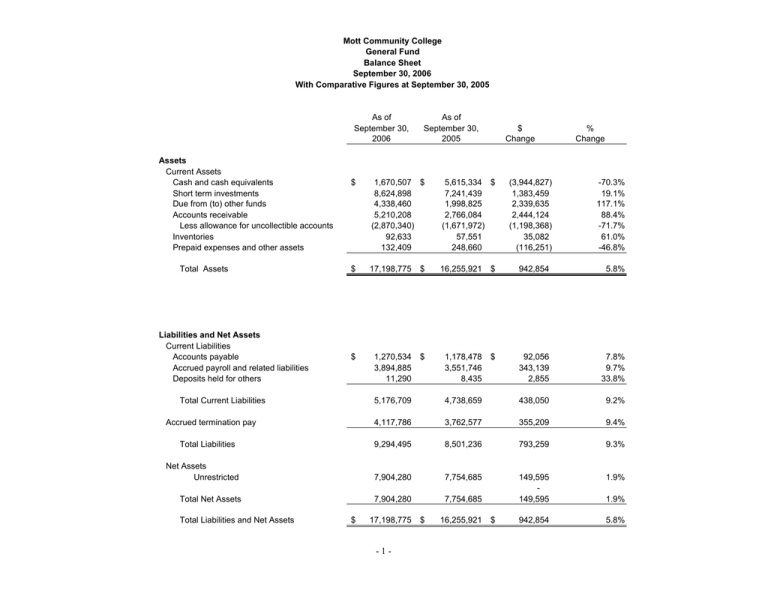
Mott Community College General Fund Balance Sheet September 30, 2006 With Comparative Figures at September 30, 2005 As of September 30, 2006 Assets Current Assets Cash and cash equivalents Short term investments Due from (to) other funds Accounts receivable Less allowance for uncollectible accounts Inventories Prepaid expenses and other assets Total Assets Liabilities and Net Assets Current Liabilities Accounts payable Accrued payroll and related liabilities Deposits held for others As of September 30, 2005 $ Change $ 1,670,507 $ 8,624,898 4,338,460 5,210,208 (2,870,340) 92,633 132,409 5,615,334 $ 7,241,439 1,998,825 2,766,084 (1,671,972) 57,551 248,660 $ 17,198,775 $ 16,255,921 $ 942,854 5.8% $ 1,270,534 3,894,885 11,290 $ 1,178,478 3,551,746 8,435 $ 92,056 343,139 2,855 7.8% 9.7% 33.8% Total Current Liabilities (3,944,827) 1,383,459 2,339,635 2,444,124 (1,198,368) 35,082 (116,251) % Change -70.3% 19.1% 117.1% 88.4% -71.7% 61.0% -46.8% 5,176,709 4,738,659 438,050 9.2% 4,117,786 3,762,577 355,209 9.4% 9,294,495 8,501,236 793,259 9.3% Net Assets Unrestricted 7,904,280 7,754,685 1.9% Total Net Assets 7,904,280 7,754,685 149,595 149,595 942,854 5.8% Accrued termination pay Total Liabilities Total Liabilities and Net Assets $ 17,198,775 -1- $ 16,255,921 $ 1.9% Mott Community College General Fund Statement of Revenues, Expenditures and Changes in Net Assets For the 2 Months Ended September 30, 2006 With Comparative Figures at September 30, 2005 Current Year - FY 2006/07 Annual Budget Prior Year - FY 2005/06 Actual as % of Actual Year-toBudget Date Annual Budget Actual Year-toDate Actual as % of Budget Revenues: 10,545,840 43.2% $ 23,054,780 $ 10,246,614 44.4% Property taxes Tuition and fees 23,441,152 6,225,450 26.6% 22,319,920 6,794,966 30.4% State appropriations 14,571,386 68,252 0.5% 14,429,785 110,086 0.8% Ballenger trust $ 24,426,645 $ 750,000 423,090 56.4% 900,000 2,158,482 431,591 20.0% 2,120,012 301,706 14.2% 65,347,665 17,694,223 27.1% 62,824,497 17,453,372 27.8% Salaries and wages 35,231,544 8,903,294 25.3% 33,396,488 8,657,488 25.9% Fringe benefits Grants and other Total revenues - 0.0% Expenditures: 14,901,706 2,991,954 20.1% 13,967,867 2,896,694 20.7% Contracted services 3,878,603 858,471 22.1% 4,066,091 914,265 22.5% Materials and supplies 1,663,876 288,552 17.3% 1,725,297 382,315 22.2% 113,477 43,708 38.5% 147,530 30,916 21.0% Facilities rent Utilities and insurance 3,015,090 609,871 20.2% 2,712,881 531,417 19.6% Operations/communications 4,030,016 586,617 14.6% 2,884,584 617,221 21.4% Transfers 2,009,623 176,375 8.8% 3,193,369 257,571 8.1% 193,512 11,343 5.9% 201,132 2,859 1.4% - 0.0% 341,750 - 0.0% 22.2% 62,636,989 14,290,746 Capital outlay Bond retirements Total expenditures Net increase/(decrease) in ne assets Net Assets Net Assets - Beginning of Year Net Assets - YTD 65,037,447 14,470,185 310,218 3,224,038 187,508 3,162,626 4,680,242 4,990,460 4,680,242 7,904,280 4,592,059 4,779,567 4,592,059 7,754,685 -2- 22.8% Mott Community College Comparative Details of General Fund Expenses Month Ended September 30, 2006 and 2005 2007 Instruction Fringe Benefits Salaries $ Public service 4,636,697 $ 922,869 Services $ 57,459 Materials and Supplies Facilities Rent $ $ 104,907 29,676 Utilities and Insurance $ 27 Other Expenses $ 26,906 Capital Outlay $ 1,016 Total $ 5,779,557 35,321 9,222 1,603 1,158 - - 1,212 - 48,516 Instructional support 1,355,717 656,704 28,544 20,500 - 14,558 40,289 - 2,116,312 Student services 1,031,185 380,518 36,234 34,587 - - 31,176 - 1,513,700 Institutional administration 808,688 535,133 139,263 2,119 1,532 175,906 426,915 Physical plant operations 809,897 378,319 237,593 123,325 12,500 419,380 5,556 10,327 Technology 225,789 109,189 357,775 1,956 54,563 - 8,903,294 $ 2,991,954 $ 2006 Instruction Fringe Benefits Salaries $ $ 858,471 Services $ 43,708 Materials and Supplies Facilities Rent $ $ $ Utilities and Insurance $ $ 14,293,810 Capital Outlay $ 392 Total - - 1,740 - 46,204 Instructional support 840,918 433,006 32,749 15,423 - 17,423 42,936 - 1,382,455 Student services 970,925 355,915 38,139 17,129 500 - 14,990 - 1,397,598 Institutional administration 803,069 546,577 102,999 30,735 2,760 178,749 477,277 Physical plant operations 803,524 363,555 209,076 212,334 25,008 335,245 510 Technology 205,914 99,114 442,973 1,225 8,657,488 $ 2,896,694 $ 914,265 $ 382,315 $ 30,916 $ 531,417 $ 617,221 $ 2,859 $ 14,033,175 $ $ (55,794) $ (93,763) $ 12,792 $ 78,454 $ (30,604) $ 8,484 $ - 28,704 11,343 794 -3- - Other Expenses $ 958 95,260 $ 586,617 8,703 245,806 2,648 609,871 34,009 Increase (Decrease) over prior year 104,675 $ 749,272 $ 1,089,824 $ 87,371 288,552 1,996,897 4,999,129 Public service $ $ - 2,089,556 $ 6,312,743 2,142,166 2,467 51,064 1,951,719 - 800,290 260,635
