Stemplots
advertisement
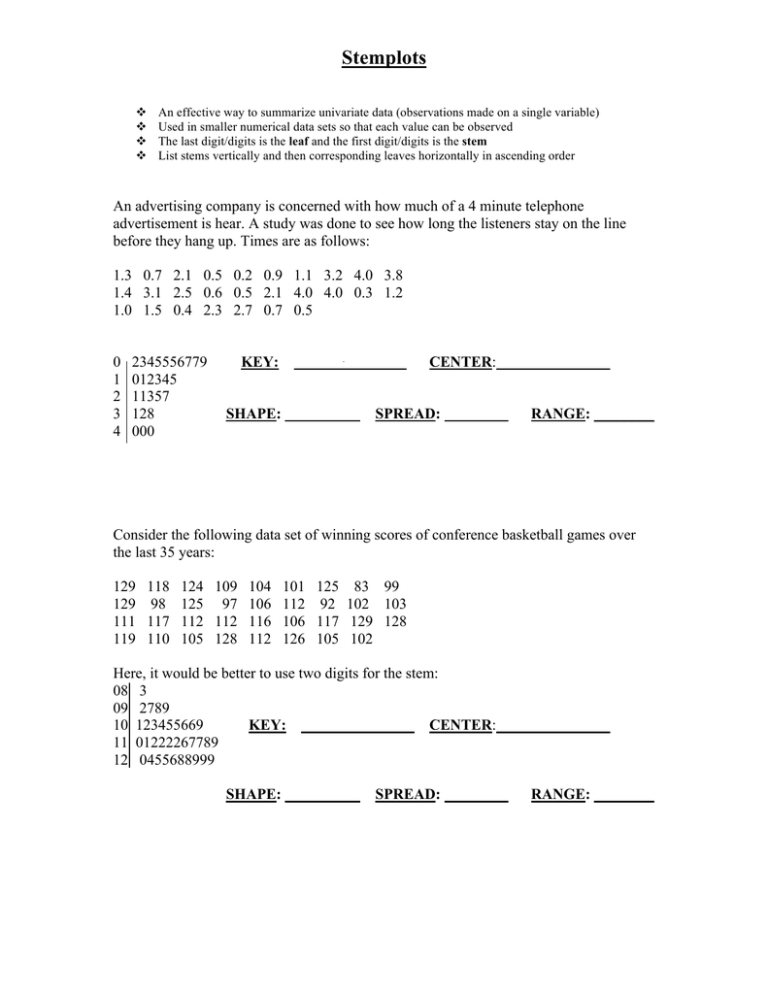
Stemplots An effective way to summarize univariate data (observations made on a single variable) Used in smaller numerical data sets so that each value can be observed The last digit/digits is the leaf and the first digit/digits is the stem List stems vertically and then corresponding leaves horizontally in ascending order An advertising company is concerned with how much of a 4 minute telephone advertisement is hear. A study was done to see how long the listeners stay on the line before they hang up. Times are as follows: 1.3 0.7 2.1 0.5 0.2 0.9 1.1 3.2 4.0 3.8 1.4 3.1 2.5 0.6 0.5 2.1 4.0 4.0 0.3 1.2 1.0 1.5 0.4 2.3 2.7 0.7 0.5 0 1 2 3 4 2345556779 012345 11357 128 000 KEY: SHAPE: CENTER: SPREAD: RANGE: ________ Consider the following data set of winning scores of conference basketball games over the last 35 years: 129 118 124 109 104 129 98 125 97 106 111 117 112 112 116 119 110 105 128 112 101 125 83 99 112 92 102 103 106 117 129 128 126 105 102 Here, it would be better to use two digits for the stem: 08 3 09 2789 10 123455669 KEY: CENTER: 11 01222267789 12 0455688999 SHAPE: SPREAD: RANGE: ________ Stemplots Take a look at the daily protein intake for 20 competitive athletes per kg of body weight: 1.4 2.2 2.7 1.5 1.7 2.3 1.5 1.8 2.8 3.0 3.3 3.3 3.4 3.5 3.2 3.0 1.8 1.9 2.0 2.3 1.5 1.9 1.7 1.8 1.6 3.0 3.5 3.5 1 455567788899 2 2733803 3 0 In a case such as this, it is important to break up the data more specifically to get a better look at its spread: 1 1 2 2 3 3 0-4 should appear on the first line 5-9 should appear on the second line 4 55567788899 KEY: CENTER: 0233 78 00233445 55 SHAPE: SPREAD: RANGE: ________ Back to Back Comparative Stem-Plot: The following two data sets give time (in seconds) of tobacco exposure in G rated children’s films. The data appeared as follows for Walt Disney Films: 10 10 10 10 11 12 13 13 15 17 25 26 27 30 32 39 The data from other films appeared as follows: 10 10 10 11 12 15 19 21 25 26 30 Other 21000 95 1 65 0 1 1 2 2 3 3 4 Disney 00001233 57 2 1 3 represents __________ for Disney 567 02 9 AND __________ for other Outliers are data values which is unusually far out from the rest of the values in a data set. 0 1 2 3 4 5 6 7 8 9 55589 123589999 22446666687 888999 44556 22 1 91 would be considered an outlier in this data set Stemplots The Game of Greed The Game Rules – Everyone stands. Everyone starts with a score of 3 Prior to each roll, students have the option of (1) sitting down and keeping their accumulated points or (2) remaining standing and gambling on the next roll. A roll of 1 causes each active (standing) player to lose their accumulated points for that round. A roll of 2-6 results in that number being added to the score for each player still standing. The round ends once a 1 comes up. Record your data here: Round 1= _____ Round 2= ______ Round 3= ______ Round 4= _____ Round 5= ____ TOTAL = _____ Record your total and your gender on the board. Males: ________________________________________________________________________________ Females:_______________________________________________________________________________ 1. From the information above, construct a back to back stemplot for the data of game totals based on gender. Make sure that your stemplot has a key! 2. Compare the distributions of game totals based on gender.
