OPTICAL PROPERTIES OF DIAMOND
advertisement
MICHAEL E. THOMAS and WILLIAM J. TROPF
OPTICAL PROPERTIES OF DIAMOND
Diamond offers unique properties for optical elements and coatings. This article reviews the properties of
diamond and presents the results of recent measurements and efforts in the modeling of its optical properties
at the Applied Physics Laboratory.
INTRODUCTION
In the past, the commercial use of diamonds was restricted to poor optical quality "industrial diamonds" for
cutting and grinding. These diamonds were either natural
diamonds unsuitable for gems or were manufactured by
subjecting graphite, the stable form of carbon at ambient
conditions, to intense pressure and temperature. The use
of diamond as an optical material was restricted to a few
specialized applications such as planetary radiometry
from satellites (e.g., Nimbus and the Pioneer series) and
high-pressure cells ("diamond anvils"). Recent progress
in the manufacture of high-quality diamonds through the
chemical vapor deposition (CVD) process opens the possibility of their use in new commercial applications,
including semiconducting diamond electronic devices,
diamond substrates as heat sinks, and durable optical
elements with wide transmission ranges.
Diamond is thermodynamically unstable at pressures
below 1.2 gigapascals (GPa), but conversion to graphite
is extremely slow at temperatures below 1500 K. Diamond synthesis was first performed by the General Electric Company in 1955 using pressures of 4.5 to 6 GPa
and temperatures of 1600 to 1900 K, which are thermodynamically stable conditions for diamond. Molten
metal catalysts cause diamond to form at practical rates
at these relatively low (for carbon) temperatures. Noncatalytic diamond synthesis requires higher temperatures
(2::2500 K) and pressures (~10 GPa). These conditions
typically yield micrometer-sized diamond powder, but
gem-quality single crystals can be grown. 1
Development of new CVD diamond growth techniques
began in the early 1980s by the Japanese and, by the end
of the decade, it became possible to make large structures
of high-quality polycrystalline diamond 2 - 3 whose mechanical,4 thermal,s -7 and optical properties approach
those of Type IIa natural diamonds (see the boxed insert).
A major advantage of the CVD technique is that growth
can occur at lower temperature (~1200 K) and very low
pressure (2500 Pa). Films are grown on a temperaturecontrolled, heated substrate, such as silicon, metal oxides, or refractory metals, using methane or acetylene
(mixed with hydrogen and other gases) as a source of
carbon (CH 3 is the active radical). Microwaves, hot
sparks, hot filaments, or other techniques are used to
dissociate the gases partially. The various CVD techniques
produce high-quality polycrystalline diamond films
16
TYPES OF DIAMONDS
Four classifications of natural diamond have been made
on the basis of optical properties. Only Type IIa is suitable
for infrared optics.
Type fa accounts for 95 to 98% of natural diamond and
contains substantial nitrogen impurity (up to 0.2%), which
forms in aggregates or platelets. This type of diamond has
strong absorption below 320 nm, low thermal conductivity
«9 W/[m·K]), and high electrical resistivity (> 10 14 n·m).
Type fb also has substantial nitrogen but in a dispersed
substitutional form. The nitrogen imparts color, ranging
from pale yellow to green, depending on nitrogen concentration. Synthetic industrial diamonds are typically Type lb.
Type IIa is gem-quality diamond essentially free of nitrogen. This type has the highest thermal conductivity
(>2000 W/[m-K]), high electrical resistivity (>10 14 n·m),
and good optical transmission.
Type lIb is also nitrogen-free but contains boron impurity
(up to 0.25 ppm in natural diamond and up to 270 ppm in
doped synthetic diamond) that results in p-type conductivity
(electrical resistivity 0.1 to 100 n·m) and imparts a blue
color to the diamond.
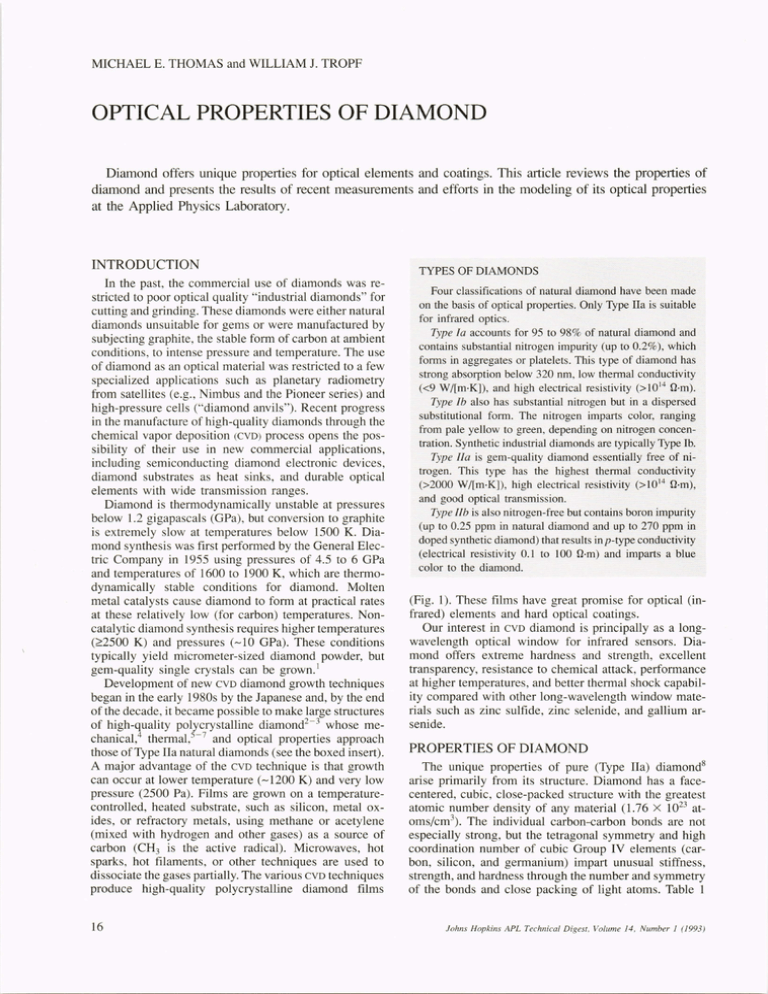
(Fig. 1). These films have great promise for optical (infrared) elements and hard optical coatings.
Our interest in CVD diamond is principally as a longwavelength optical window for infrared sensors. Diamond offers extreme hardness and strength, excellent
transparency, resistance to chemical attack, performance
at higher temperatures, and better thermal shock capability compared with other long-wavelength window materials such as zinc sulfide, zinc selenide, and gallium arsenide.
PROPERTIES OF DIAMOND
The unique properties of pure (Type IIa) diamondS
arise primarily from its structure. Diamond has a facecentered, cubic, close-packed structure with the greatest
atomic number density of any material (1.76 X 10²³ atoms/cm 3). The individual carbon--carbon bonds are not
especially strong, but the tetragonal symmetry and high
coordination number of cubic Group IV elements (carbon, silicon, and germanium) impart unusual stiffness,
strength, and hardness through the number and symmetry
of the bonds and close packing of light atoms. Table 1
fohns Hopkins APL Technical Digest, Vo lume 14, Number 1 (1993)
Figure 1. Polycrystalline diamond windows made by Norton (DiamaTorr process). The square windows are 1 in. on
a side and are polished ; the 4-in. circularwafer is unpolished. All samples are
about O.5-mm thick. The slight brown
coloring is due to scatter. (Photograph
courtesy of the Norton Diamond Film
Company.)
compares the hardness of diamond with other very hard
materials. Diamond is the stiffest, strongest, and hardest
known material by at least a factor of 2. 8
In addition to diamond 's unique mechanical properties, its thermal properties are also unusual. The strong
net bonding results in very low thermal expansion, high
acoustic frequencies (and hence a very high Debye temperature of 2220 K), and low room-temperature heat
capacity. Even more remarkable is the exceptionally high
room-temperature thermal conductivity of diamond,
which is more than five times that of metals such as silver
or copper. This large thermal conductivity results in high
resistance to thermal shock and thermal lensing.
Table 2 compares the thermal conductivity of natural
diamonds and CYD diamonds. Thermal conductivity is a
strong function of impurities (especially nitrogen), defect
concentration, and isotopic content. Recent research on
the thermal conductivity of diamond shows a 50% increase when Be content is reduced to 0.1 % (from its
natural 1.1 % abundance). 1,9 The thermal conductivity of
recently developed thick polycrystalline diamond films
approaches that of a single crystal.
Type IIa diamond is an excellent insulator and is resistant to chemical attack at ordinary temperatures. Diamonds heated above 875 K in the presence of oxygen
or other catalytic agents form a graphite surface coating.
Oxidation rates are 0.1 ILm/h at 600°C and 4 ILm/h at
700°C. 12 In vacuum, significant conversion to graphite
("graphitization") requires temperatures above 1800 K.
Table 3 summarizes the properties of Type IIa diamond. Additional electronic, lattice, and transport properties are presented in standard handbooks.21
OPTICAL PROPERTIES OF DIAMOND
Diamond 's structure contributes to its unique optical
properties , and its symmetry results in a pure covalent
bonding, which accounts for the absence of infrared
Johns Hopkins APL Technical Digest, Vo lume 14, Number J (/993)
Table 1. Comparison of the Knoop hardness of diamond with that
of other hard materials. 8
Material
Hardness
(kg/rrun 2)
Diamond
Boron nitride
Boron carbide
Tungsten carbide
Sapphire
9000
4500
2250
2190
2000
Table 2. Thermal conductivity of diamond.
Type
Natural, IIa lO,11
(or artificial)
Natural,Ia 1,8,1O,1l
(1.7 X lO2D/ cm3 N)
Artificial,I ,9
(99.9% 12C)
CVD5-7
Thermal conductivity
(W/[m·KJ)
2000 to 2300
800
3320
1280 to 1700
optical activity (no interaction of light with lattice vibrations) . To first order, diamond is transparent from its
(indirect) electronic band gap (at 225 ILm) to the microwave region. Higher-order (multiphonon) lattice absorption processes cause significant absorption in the 2.5- to
6-lLm region. Diamond has a Raman-active optical
mode22 (F2g or r (2S+) symmetry) at l332.4 cm- 1 (7.505
ILm). A sharp Raman line indicates high-quality diamond
and is used as a qualitative measure of CYD films, al17
M. E. Thomas and W. 1. Trap!
Table 3. Room temperature properties of Type lIa diamond.
Property
Space group
Lattice constant l3
Density 14
Elastic moduli IS,a
Engineering moduli
(random average)
Poisson's ratio
Knoop hardness 8
Strength 8
Melting point l6
Debye temperature8
Heat capacity 17
Thermal expansion l 8
Thermal conductivitylO,ll
Band gap,19
Refractive index,20 n D
Abbe number,b v D
Dielectric constant,2°E
Value
Fd3m (O~)
0.356683 nm (Z = 8)
3.51525 g/cm3
C II = 1076.4 GPa
c 12 = 125.2 GPa
c44 = 577.4 GPa
elastic: 1143 GPa
shear: 535 GPa
bulk: 442 GPa
0.0691
9000 kg/mm 2 (500 g)
2500 to 3000 MPa
4100 K (P = 12.5 GPa)
2200K
6.195 J/(mol·K)
0.8 X 1O- 6/K
2300 W/(m·K)
5.50eV
2.41726
55.3
5.70
(dE/dT)p = 4.61 X 1O- s/K
(dE/dP)T = - 4.1 X 1O- 12/pa
Note: Z = number of atoms in a unit cell.
apressure and temperature dependence of the elastic constants can be
found in H. J. McSkimin and P. Andreatch, "Elastic Moduli of
Diamond as a Function of Pressure and Temperature," 1. Appl. Phys.
43, 2944-2948 (1972).
bReference 8, p. 650, gives refractive indices nc = 2.40990, nD =
2.41726, nF = 2.43554, and liD = 55.3; source is unknown.
though small grain size «'ARaman/2) reduces Raman intensity.23 Nondiamond character is usually revealed by
Raman response 2 near 1550 cm- I .
Visible Properties
The refractive index n of diamond 24 - 26 is given by the
Sellmeier equation,24
4.3356'A2
0.3306'A2
n -1 = 'A2 _ (0.1060)2 + 'A2 _ (0.1750)2 '
and infrared (e.g., at 7.8 /Lm) absorption, slight birefringence, and decreased thermal conductivity. 13 Metals such
as iron, aluminum, magnesium, and others are believed
to cause green and brown coloration. Type IIa diamonds
are clear with very low concentrations of nitrogen
(::;20 ppm), boron, and other impurities.
Optical scatter in single-crystal Type IIa diamonds is
very low. Polycrystalline CVD diamond has higher scatter
caused by grain boundaries. Grain size and surface polish
determine the scatter level in CVD diamond, and scatter
can significantly limit transmission in the visible, ultraviolet, and near-infrared regions. 28 Scatter in CVD diamond is recognized by a gray or brown cast to the sample
and by uniformly decreasing transmission at high frequency.
Ultraviolet Properties
Figure 2 shows an APL measurement of the ultraviolet
transmission of a Type IIa diamond window (0.5-mm
thickness) in the region near its band gap. The extinction
coefficient also shown in Figure 2 is derived using the
index of refraction from Equation 1 and solving the
resulting quadratic equation that relates the absorption
coefficient to transmittance. The exponential increase in .
absorption with frequency (or energy) near the band gap
(5.5 eV) is known as the Urbach edge. The ultraviolet
absorption coefficient (3 can be modeled as a function of
energy E (in e V) and temperature T by the equation
(3(E, T) = (30 exp[a(T)(E -
(2)
where kB is Boltzmann's constant.
Using the room-temperature absorption data of Figure
2 and assuming a value of 6.5 eV (the direct band gap)
for the constant Eo of Equation 2, gives the following
parameters for the Urbach edge model: (30= 4.23 X 10¹¹
cm- \ a(300 K) = 0.585. Temperature-dependent absorption measurements are needed to derive the temperature
dependence of aCT) and give the precise location of Eo.
120
2
Urbach edge model
(1)
where the wavelength 'A is in micrometers. This equation
can be used to determine reflectivity from 0.225 /Lm (in
the ultraviolet) through the infrared. Note that diamond
has a high index of refraction with high dispersion in the
visible (which is enhanced by the cut of diamond gems)
and essentially no dispersion in the infrared. 2s
The temperature derivative of the refractive index
(thermo-optic coefficient) is available for visible wavelengths27 and at low frequency20 and is given in Table 4.
Color in diamond comes from impurities. Nitrogen and
boron are the principal impurities and impart yellow and
blue coloring, respectively, when they are in sufficient
concentration. The nitrogen impurity can take several
forms: single-substitution as well as distinct types of
precipitates ("platelets"). Nitrogen causes an increased
lattice constant, increased ultraviolet (e.g., at 0.3065 /Lm)
18
Eo)],
kBT
100 'I
100
E
~
~
~
80
80
u
c
.;l
E
(J)
c
Cll
.=
C
Q)
'(3
Q)
;.-::
60
60
40
40
Weak
tail
20
model
20
0
0.20
Q)
0
u
c
0
U
c
~
w
0.25
0.30
Wavelength (/km)
Figure 2. Our measurement of the ultraviolet transmission and
absorption coefficient of Type lIa diamond (0.5-mm thick) at room
temperature. The gradually rising absorption (weak absorption tail)
becomes rapid (Urbach absorption edge) atthe band gap (225 nm).
Both types of absorption can be described by exponential functions.
f ohns Hopkins APL Technical Digest, Volume 14, Number 1 (1 993)
Optical Properties of Diamond
Table 4. Temperature derivative of the refractive index n of diamond.
Wavelength (Jlm)
0.4358
0.5461
0.5893
Long
Refractive index
2.4499
2.4237
2.4 173
(2.39)
(dn/dT) X 1O-6jK
(l/n)dn/dT X 1O-6jK
1l.4
10.1
9.8
9.6
4.65
4.17
4.05
4.04
Ref.
27
27
27
20
The featureless extinction between 0.225 and 0.35 j.tm
is believed to be caused by absorption rather than scatter. 8
This absorption is also approximately exponential with
energy and can be modeled as
(3(E)
= 0.28 exp(0.45E) ,
(3)
where E is again in e V and the absorption coefficient is
in cm - I. This equation is in the usual fonn of the temperature-independent "weak-tail" absorption observed in
crystalline and semiconductor material
Infrared Properties: Measurements
Our major interest in the optical propel1ies of diamond
is the significant multi phonon absorption region (see the
boxed insert) that lies between 2.5 and 6 j.tm. This absorption limits the usefulne of diamond windows in the
middle infrared region frequently u ed by infrared sensors. Measurements were made of natural, single-crystal
Type IIa diamonds provided to us by the U.S. Army
Strategic Defense Command (Figure 3). Figure 4 shows
the room temperature absorption coefficient of diamond
derived from transmission measurements. This figure
clearly shows two- , three- and four-phonon absorption.
We believe Figure 4 documents the first observation of
four-phonon absorption in diamond. The triangle marks
absorption measured by laser calorimetry,29 which is used
to calibrate the spectral transmittance. Also shown are our
models of the absorption coefficient, which are discussed
in this section.
Absorption at the infrared edge of insulators is caused
principally by anhannonic tenns in the lattice potential.
These higher harmonics of the lattice resonances are
infrared active even if the fundamental vibrations are not.
This phenomenon is called multi phonon absorption because the light is absorbed by exciting multiple (two or
more) lattice phonons (vibrations). For infrared absorption, each succe sively higher multiple of the fundamental frequency is weaker (and broader), leading to decreasing absorption beyond the highest fundamental absorption frequency (the maximum transverse optical phonon
frequency). The resulting infrared absorption edge of
most materials (especially highly ionic insulators) is
characterized by an absorption coefficient that decreases
exponentially with frequency. At about three times the
highest transverse optical frequency, the absorption coefficient becomes reasonably small, and a material with
a thickness from 1 to 10 mm is basically transparent.
Group IV materials with the diamond structure are
unique in that no infrared-active fundamental lattice vibrations are present: to first order, the material is transparent throughout the infrared. Higher-order (mulJohns Hopkins APL Technical Digest. Vo lume 14, Number 1 (1993)
Figure 3. Natural Type lIa diamonds supplied by the U.S. Army
Strategic Defense Command for characterization . Sample F-805
(left) is 9.5-mm long , has a clear aperture of 4 mm, and weighs
0.150 g. Sample F-806 , used for the measurements reported here,
is 1O-mm square , 0.5-mm thick, and weighs 0.166 g. Sample F-807
is 13.8-mm long, 0.32-mm thick, weighs 0.104 g, and has a small
crack (dark area) at the bottom. (One carat equals 0.2 g.)
tiphonon) absorptions are, however, optically active and,
in diamond, cause considerable absorption in the 2.5- to
6-j.tm (1700- to 4000-cm- 1) spectral region.
Figure 5 shows absorption in the 10-j.tm region. This
measurement was made using a longer integration time
than was used for Figure 4. The longer integration time
improves the signal-to-noise ratio at the expense of absolute accuracy. These data have been corrected using
well-established features from short integration time
measurements. The absorption features seen are real; they
arise from the intrinsic vibrational modes of diamond
activated by defects and impurities and possibly by infrared bands associated with defect centers and substitutional impurities. Many of these features can be correlated with zone-edge critical-point phonon vibrations 30 vi ible in Figure 5. The triangle marks absorption measured
by laser calorimetry (also shown in Fig. 4).
We have also measured the temperature dependence of
the infrared absorption coefficient. As temperature increases, the multiphonon absorption becomes stronger
and reaches the classical limit of T 1/-1 at high temperature, where n (""vjvRaman) is the number of phonons contributing to absorption. At low temperature, absorption
has no temperature dependence, since only transitions
from the ground state occur. Once the temperature is
sufficiently high (i.e. , approaching the Debye temperature), transitions that originate from excited states become important, and the classical temperature depen19
M. E. Thomas and W. 1. Trop!
100 .---------~----------.---------~----------,----------,
L(X) + TA(X)
Figure 4. Our measurement of the
infrared absorption coefficient of Type
lIa diamond at room temperature. The
two-, three- , and four-phonon absorptions in the 1000- to 5000-cm - 1 (2- to
1O-lLm) spectral region are clearly seen.
Some two-phonon spectral features
are labeled with their spectroscopic
identification (e.g. , L[x] is the longitudinal frequency at the X critical point) .30
These features , predicted by theory,
are observed at the expected locations. Also shown are the optical and
acoustic components of our multiphonon absorption model and a laser
calorimetry measurement (triangle).29
10
/
"I
E
~
Optical 2-phonon
absorption model
I
C
Q)
20(r)
(2-Raman)
'(3
;;::
Q)
0
Natural diamond
/(298 K)
Composite 2-phonon
u
c
0
li
(;
(/)
.0
«
0.1
~
0.01
Optical 3-phonon
absorption
L -_ _ _ _~~~_ __ _~_ __ _L __ _~_ __ _~_ _ _ __ __ _ _ _~_ _ _ _ _ _ _ _~
o
3000
2000
1000
4000
5000
Wave number (cm- 1)
0.25 ,----.---- - - , - - - - - - ,- - - - , -- -.------,
ABSORPTION IN SOLIDS
The absorption of light in insulating solids arises from
two principal sources: electronic transitions and lattice
vibrations. Electronic absorption typically occurs in the
ultraviolet, whereas absorption by lattice vibrational modes
occurs in the infrared.
A phonon is a quantum of lattice vibration (elastic)
energy (as the photon is the quantum of electromagnetic
energy). Phonons are classified as either acoustic (compression waves) or optic. Optic phonons that are infrared active
absorb light through an interaction between the electric field
of the light and the dipole moment of the material. Diamond
is a symmetric, covalent material with no dipole moment
and therefore has no infrared active phonons.
Weak phonon absorption can be induced in solids by very
intense light (Raman -active phonons) or by combinations
of phonons (multiphonons) that create weak dipole moments. Diamond has one Raman mode (observed at 1332.4
cm - I) and one acoustic mode.
In crystals, frequencies of these modes change with
propagation direction, creating many two-phonon absorption features. These multiphonon absorption bands are
weak compared with fundamental (one-phonon) absorption
and occur at frequencies that are harmonics of the fundamental frequency.
In diamond, which has no infrared-active one-phonon
absorption, multiphonon effects dominate infrared absorption.
dence is observed. Figure 6 shows measured absorption
coefficients at room temperature and at 771 K. Table 5
summarizes the band-integrated results for several temperatures. These absorption data are shown in Figure 7
compared with the classical temperature dependence.
Note that the higher multiphonon contributions grow
more rapidly with temperature as expected but have not
reached a temperature where the classical limit applies.
20
f' 0.20
E
~
C
.~
0.15
;;::
Q)
o
u
§ 0.10
'a(;
(/)
~ 0.05
OL---~--~------l-----~----~----~
600
700
800
900
1000
Wave number (cm-
1
1100
1200
)
FigureS. Room-temperature absorption in the 1O-lLm (1 000 cm - 1)
region . A longer integration time was used to reduce the noise seen
in Figure 4. The various absorption features are caused by fundamental vibrational modes of diamond that would normally not be
observed unless activated by defects and impurities. Some of
these zone-edge critical-point vibrations are identified by their
spectroscopic notation , as in Fig. 4. 30 Also shown is the laser
calorimetry measurement (triangle) from Figure 4. 29
Another noticeable feature of the higher temperature
data is the shift of the absorption bands to lower frequency. This red shift is caused by the increased population
of higher energy levels coupled with the lower energy
separation of these higher levels.
Chemical vapor deposition diamond has additional absorption features in the one-phonon region (500 to 1332
cm- I ) caused by greater concentration defects and impurities. 3o The optical (infrared) quality of diamond can be
assessed by directly measuring absorption. As CVD techniques have improved, infrared absorption in CVD diamonds has approached that of natural diamonds.
John s Hopkins APL Technical Digest, Volume 14, Nu mber 1 (/993)
Optical Properties of Diamond
100,---------.----------.---------,,---------.---------~
"'I
E
10
~
Figure 6. Temperature dependence
of the infrared absorption coefficient.
The blue curve shows room temperature absorption , and the green curve
shows the absorption coefficient at
771 K. Note the red shift of the absorption spectra at high temperature and
the more rapid growth of the strength
ofthe higher-order multiphonon bands.
C
Q)
'u
;;::::
Q)
0
u
c
0
'a
0
(/J
.0
<C
0.1
Natural diamond
(298 K)
0.01
L -_ _ _ _ _ _-U~_ _ _ _ _ _ _ _~_ _ _ _ _ _ _ _ _ __ L_ _ _ _ _ _ _ _~_ _ _ _ _ _ _ _~~
o
1000
2000
Wave number
3000
4000
5000
(cm- 1)
100,--------------,---------------------.
Infrared Properties: Models
We have successfully developed a semiempirical,
quantum mechanical model of (sum-band) multiphonon
absorption based on the Morse interatomic potential and
a modified Gaussian function for the phonon density of
states. 31 Use of the Morse potential leads to an exact
solution to the Schrodinger equation that includes anharmonic effects to all orders. The central limit theorem
ensures that the phonon density of states becomes Gaussian for high-order multiphonon absorption. Our model
contains parameters derived from room temperature
measurements of absorption, it is computationally efficient, and it has been successfully applied to many ionic
substances. 32 Surprisingly, this model can also be applied
to diamond. 33 Figure 4 shows the result.
Our multiphonon model is based on only six parameters: a dissociation energy (the depth of the Morse
potential well), the maximum longitudinal optical
phonon frequency, an absorption scaling constant, and
three parameters that describe the phonon density of
states. No optically-active modes are present in diamond;
therefore, no maximum longitudinal frequency exists for
the model. Instead, we use the Raman frequency and note
the sharp decrease in absorption at two, three, and four
times the Raman frequency (Fig. 4). Our multiphonon
optical model cannot accurately reproduce the spectral
content of the two-phonon region, which consists of
many different two-phonon interactions,3o because diamond does not conform to the near-Gaussian density of
states assumption that becomes accurate only when several phonons interact (typically, three or more phonons).
Some of the two-phonon spectral features are labeled in
Figure 4.
Diamond absorptance near 10 JLm (1000 cm -1) is of
particular interest because many infrared sensors operate
at this wavelength. Evidence indicates that the absorption
edge bounding this region is caused by two-phonon
acoustic-acoustic interactions. Normally, pure acoustic
multiphonon absorption is not measurable because it is
obscured by strong one-phonon absorption. Diamond has
Johns Hopkins APL Technical Digest, Volume 14, Number 1 (1993 )
Spectral region:
T1
"'I
E
--
1950-2044
~
C
Q) 10
'u
- 1660-2660
~0
u
T2
2400-2575
c
0
'a
0
(/J
/
.0
co
"0
/
Q)
3047-3722
2660-3890
OJ
co
CD
>
co
/
/
/
/
/
/
3-phonon
/
/
T3
-6
c
co
./
./
m
./
./
./'
./'
./
./
./
0.1
300
500
Temperature (K)
1000
Figure 7. Temperature dependence of band-averaged infrared
absorption coefficient for two-, three-, and four-phonon regions.
Dashed curves show the p -l absorption dependence predicted by
classical theory for high temperatures (n is the order of the phonon
contribution). Lower signal-to-noise ratio accounts forthe irregularity of the four-phonon result.
very high acoustic frequencies because of its strong
bonds, and the lack of fundamental absorption unmasks
the pure acoustic contribution. We model this contribution
by assuming a Debye acoustic single-phonon distribution
Pl(W) of the form
21
M. E. Thomas and W. 1. Trap!
Table 5. Band-averaged , temperature-dependent absorption coefficient (in cm - 1) of natural diamond from
transmission measurements.
Temperature (K)
522
656
6.72
7.40
13.73
15.01
4.50
4.91
Absorption
type
Two-phonon
Spectral band
cm- I
j-tm
3.76-6.02
1660-2660
4.89-5.13
1950-2044
3.88-4.17
2400-2575
298
6.02
12.23
4.17
Three-phonon
2660-3890
3047-3722
2.57-3.76
2.69-3.28
0.77
1.05
0.84
1.11
1.12
1.41
1.38
1.66
Four-phonon
3890-5028
1.99-2.57
0.22
0.30
0.55
0.67
771
8.48
16.97
5.55
CONCLUSION
(4a)
where P is the density of states distribution function for
acoustic modes, W is the angular frequency, and W max is
found by fitting to data. Higher-order (nth) acoustic
phonon distributions are computed by convolving this
distribution with the n - 1 phonon distribution:
rn XWm ax
Pn(w) = J
Pn-l (w')p(w - w')dw' .
o
(4b)
For the two-phonon distribution, the result is
9
- 6-
W max
?
w- 3
-3 [w m ax
{
4
-
(w - wmax )
4
3
]
W
1
--[w
max -(w-w max ) ]+-[w max -(w-w max )
2
5
5}
]
REFERENCES
(4c)
Using the parameter Wmax = 1183 cm- I and an absorption
scaling constant of 487.5 cm - 2 gives the result shown in
Figure 4. This second (acoustic) contribution, although
weak, is important because it lies in the 8- to 10-JLffi
atmospheric window frequently used by infrared sensors.
Note that our selected value of 1183 cm - I is consistent
with both the computed Debye frequency as well as the
highest reported acoustic frequency. 3D Using a high-temperature value of 1860 K for the Debye temperature of
diamond 8 gives a Debye frequency of 1290 cm - I. The
highest observed acoustic frequency for diamond ranges
from 1185 to 1191 cm -I (longitudinal acoustic frequency
at the X critical point = LA[X]), consistent with the value
that best fits the data.
22
We measured the room temperature ultraviolet transmission of diamond and derived the absorption coefficient. Ultraviolet absorption at the band gap was characterized as an Urbach absorption edge model. We have
also measured and characterized the weak absorption tail
for this particular sample. Additionally, the room- and
elevated-temperature transmission of diamond in the infrared has been measured. For the first time, four-phonon
absorption was observed, and the temperature dependence of the two-, three-, and four-phonon absorption
was determined. We have demonstrated that the general
infrared absorption features of diamond can be duplicated
by our multiphonon model, which was originally developed for highly ionic materials. Acoustic contributions to
multiphonon absorption, which are important in the 10JLm spectral region, can also be modeled.
1Strong, H. M. , and Wentorf, R. H. , " Growth of Large, High-QuaJity Diamond
Crystals at General Electric," Am. 1. Phys. 59 1005-1008 ( 1991 ).
2 Yarbrough, W. A. , and Messier, R., "Current Issues and Problems in the
Chemical Vapor Deposition of Diamond," Science 247, 688-696 (1990).
3Geis, M. W., and Angus, 1. c., " Diamond Film Semiconductors," Scientific
American , 84-89 (Oct 1992).
4Jiang, X. , Harzer, J. V., Hillebrands, B. , Wild, Ch. , and Koidl, P., "Brillouin
Light Scattering on Chemical-Vapor-Deposited Pol ycrystalline Diamond:
Evaluation of the Elastic Moduli ," Appl. Phys. Lett . 59, 1055- 1057 (1991).
5Morelli , D. T. , Hartnett, T. M., and Robin son, C. I. , "Phonon-Defect
Scattering in High Thermal Conductivity Diamond Films," Appl. Phys. Lett.
59, 2112-2114 (1991 ).
6Lu . G ., and Swann, W. T., " Mea urement of Thermal Diffusivity of
Polycrystalline Diamond Film by the Converging Thermal Wave Technique,"
App/. Phys. Lett. 59, 1556-1558 (1991 ).
7 Graeber, J. E., Jin, S., Kammlott, G . W. , Herb, J . A. , and Gardner, C. F.,
" Unusually High Thermal Conductivity in Diamond Films," Appl. Phys. Lett.
60, 1576-1578 (1992 ).
8Field , J. E. , The Properties of Diamond, Academic Press, San Diego ( 1979).
9 Anthony, T . R. , Banholzer, W. F., Fleischer, J . F. , Wei , L. , Kuo, P. K. , et aJ .,
"Thermal Diffusivity of IsotopicaJl y Enriched 12C Diamond," Phys. Rev. B
42, 1104-1111 (1990).
1OBerman, R. , Foster, E . L. , and Ziman, J. M., "The Thermal Conductivity of
Dielectric Crystals: The Effect of Isotopes," Proc. Royal Soc. (London) A237,
344-354 ( 1956).
II Berman , R., and Martinez, M., "The ThermaJ Conducti vity of Diamonds,"
Diamond Research 1976 (Suppl. to Ind. Diamond Rev. ), 7- 13 ( 1976).
f ohns Hopkins APL Technical Digest. Vo lume 14 , Number I (1 993)
Optical Properties of Diamond
1210hnson, C. E., Weimer, W. A. , and Harris, D. c., "Characterization of
Diamond Films by Thermogravimetric Analysis and Infrared Spectroscopy,"
Mat . Res. Bull. 24, 1127- 1134 ( 1989).
13 Kaiser, W., and Bond, W. L., " Nitrogen , a Major Impurity in Common
Type I Diamond," Phys. Rev. 115, 857-863 (1959).
14Mykolajewycz, R. , Kalnajs, 1., and Smakula, A. , " High-Precision Density
Determination of atural Diamonds," J . Appl. Phys. 35, 1773-1778 (1964).
15Grimsditch, M. H. , and Ramdas, A. K. , " Brillouin Scattering in Diamond,"
Phys. Rev. B 11, 3139-3148 (1975).
16Bundy, F. P., "Melting Point of Graphite at High Pressure: Heat of Fusion,"
Science 137, 1055-1057 (1963).
17 Victor, A. c., " Heat Capaci ty of Diamond at High Temperature," 1. Chem.
Phys. 36, 1903-1911 (1962).
18Slack, G. A., and Bartram, S. F. , "Thermal Expansion of Some Diamondlike
Crystals," J . Appl. Phys. 46, 89-98 (1975).
19 Himpsel, F. J., Knapp, 1. A., van Vechten, J. A., and Eastman , D. E.,
"Quantum Photoyield of Diamond(1 I I)-A Stable Negative-Affinity Emitter," Phys. Rev. B20, 624-627 (1979).
20 Fontanella, J. , Johnston, R. L., Colwell, 1. H., and Andeen, c., " Temperature
and Pressure Variation of the Refractive Index of Di amond," Appl. Opt. 16,
2949-2951 (1977).
21 Madelung, O. (ed.), Semiconductors: Group IV Elements and III- V Com pounds, pp. 5-11, Berlin (1991 ).
22 S01in, S. A., and Ramdas, A. K., " Raman Spectrum of Diamond," Phys. Rev.
B 1, 1687-1698 (1970).
23 amba, Y. , Heidarpour, E. , and akayama, M. , "Size Effects Appearing in
the Raman Spectra of Po lyc rystalline Diamonds," J . Appl. Phys. 72, 17481751 (1992).
24Peter, F. , "Ober Brechungsindize und Absorptionkonstanten des Diamanten
zwischen 644 und 226 mIL," Z. Phys. 15, 358-368 (1923).
25Edwards, D. F., and Ochoa, E., "Infrared Refracti ve Index of Diamond," 1.
Opt. Soc. Am. 71, 607-608 (1981).
26Rosch , S., " Die Optik des Fabulit, die Farbe des Brewsterwinkel s und das
Farbspielmoment," Optica Acta 12, 253-260 (1965).
27 Ramachandran, G. N. , "Thermo-optic Behavior of Solids: I. Diamond," Proc.
Ind. Acad. Sci. A25, 266-279 (1947).
28 Mc eely,1. R. , Akerman, M. A., Cl ausing, R. E. , Mcintosh, M. B. , Snyder,
W. B. , Thomas, M. E. , and Linevsky, M. 1., " High Temperature Optical
Characterization of CVD Diamond," in 1992 Technical Digest from the OSA
Annual Meeting, Optical Society of America, Washington, D.C. Sep 1992.
29 Harris, K., Herrit, G. L. , Johnson, C. 1., Rummel , S. P. , and Scarena, D. 1.,
"Infrared Optical Characteristics of Type 2A Diamonds," Appl. Opt. 30 ,
5015-50 17 (1991). Erratum: Appl. Opt. 31,4342 (1992).
30 Klein , C. A., Hartnett, T. M., and Robinson, C. J., "Critical-Point Phonon
Frequencies of Diamond," Phys. Rev. B 45, 12,854-12,863 (1992).
3 1Thomas, M. E., Joseph, R. I., and Tropf, W. J., " Infrared Transmission
Properties of Sapphire, Spinel , Yttria, and ALON as a Function of Frequency
and Temperature," Appl. Opt. 27, 239-245 (1988).
32 Sova, R. M. , Linevsky, M. J. , Thomas, M. E. , and Mark, F. F., "HighTemperature Infrared Properties of Oxides," Johns Hopkins APL Tech. Dig.
13, 368-378 (1992).
33 Thomas, M. E., and Joseph, R. I., " Optical Phonon Characterization of
Diamond, BeryUia, and Cubic Zirconia," Proc. SPIE 1326, 120-1 26 (1990).
ACKNOWLEDGMENT: We wish to thank the U.S. Army Strategic Defense
Command and Gail H. Lowe for supporting this work.
THE AUTHORS
MICHAEL E. THOMAS received
a B.E.E. from the University of
Dayton and an M.S . and Ph.D.
from Ohio State University. He
joined APL in 1979 and has been
working on electromagnetic propagation and optical properties of
materials. In 1982, he was a
postdoctoral fellow in the Department of Physics, Naval Postgraduate School. In 1988, Dr. Thomas
became a part-time G.W.c. Whiting School of Engineering faculty
member, teaching coures on optical propagation and lasers. Current research intere ts include ex~ perimental and theoretical modeling of atmospheric propagation in
JR, DIAL, lidar, optical and JR window materials, and the JR properties
of high-pressure gases. He has published over fifty book and journal
articles in these fields. Dr. Thomas is a senior member of IEEE and
holds membership in the Optical Society of America, SPIE, and Tau
Beta Pi.
I
Johns Hopkins APL Technical Digest, Vo lume 14, Number I (/993)
WILLIAM J. TROPF received a
B.S . from The College of William
and Mary (1968) and a Ph.D. from
the University of Virginia (1973),
both in physics. Dr. Tropf joined
APL in 1977 and became a member
of the Principal Professional Staff
in 1981. Currently, he is supervisor
of the Electro-Optical Systems
Group in APL's Fleet Systems Department. His research interests are
measuring and modeling the optical properties of materials, including developing a computer code
recently licensed to Applied Research Corporation to predict optical properties as a function of
wavelength and temperature. Dr. Tropf believes that understanding
material properties is a key factor in developing high-performance
systems. He has contributed to chapters on optical materials in the
Handbook of Optical Constants of Solids II, Electro-optics Handbook,
and the soon-to-be-published Optical Society of America Handbook of
Optics, 2nd edition.
23
