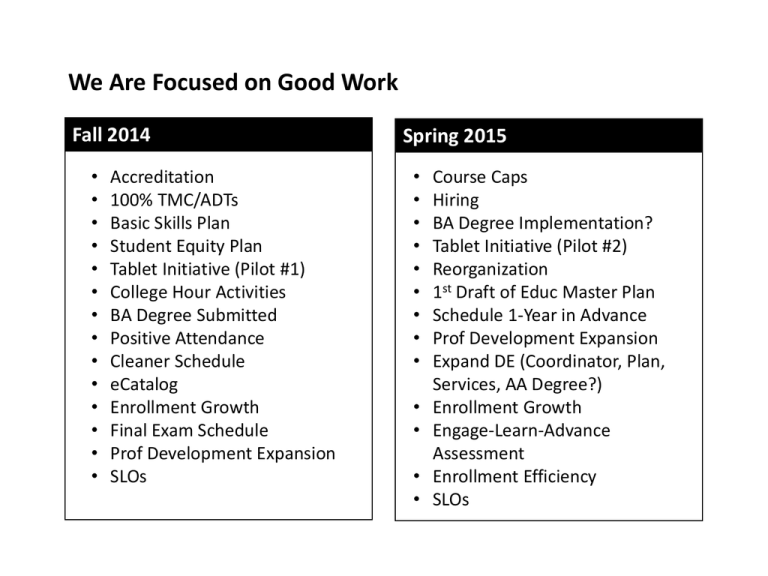
We Are Focused on Good Work Fall 2014 Spring 2015
advertisement

We Are Focused on Good Work Fall 2014 • • • • • • • • • • • • • • Accreditation 100% TMC/ADTs Basic Skills Plan Student Equity Plan Tablet Initiative (Pilot #1) College Hour Activities BA Degree Submitted Positive Attendance Cleaner Schedule eCatalog Enrollment Growth Final Exam Schedule Prof Development Expansion SLOs Spring 2015 • • • • • • • • • • • • • Course Caps Hiring BA Degree Implementation? Tablet Initiative (Pilot #2) Reorganization 1st Draft of Educ Master Plan Schedule 1-Year in Advance Prof Development Expansion Expand DE (Coordinator, Plan, Services, AA Degree?) Enrollment Growth Engage-Learn-Advance Assessment Enrollment Efficiency SLOs Students Are Benefitting from Your Efforts Enrollment Growth Community College Week recently ID’d Crafton as the 9th fastest growing college in the country (enrollments from 5,000 to 10,000) Student Opinion Spring 2014 • 95% satisfied with instruction and overall ed experience • 93% believe receiving a great education • 96% believe library resources meet needs and tutoring services readily available • 92% satisfied with overall services for students • 96% believe campus is clean, well-maintained, grounds are well-cared for. • 92% believe computer labs are adequate and accessible Students Are Benefitting From Your Efforts Retention Rates Success Rates 92.00% 91.0% 75.00% 74.0% 74.00% 90.00% 73.00% 72.00% 88.00% 71.00% 86.00% 70.00% 69.00% 84.00% 68.00% 67.00% 82.00% 66.00% 80.00% 65.00% SP11 SP12 SP13 SP14 6th Highest in California Crafton Hills College All California CCs SP11 SP12 SP13 SP14 16th Highest in California From California Community College Chancellor’s Data Mart Retention and Success Comparisons—Inland Empire #1 in Inland Empire for Combined Score Enrollment Retention Success Combined CA IE Count Rate Rate Rate Rank Rank Crafton Hills Chaffey Desert Moreno Valley Copper Mountain Palo Verde Norco Victor Valley San Bernardino Riverside Mt. San Jacinto 14,372 49,681 23,026 16,470 4,066 4,953 17,922 28,520 31,691 39,474 36,894 91.0% 90.3% 87.5% 86.7% 87.6% 87.1% 86.1% 91.2% 87.9% 85.6% 84.6% 74.0% 71.5% 71.9% 71.3% 70.2% 70.9% 70.6% 64.6% 66.8% 66.8% 67.4% 82.5% 80.9% 79.7% 79.0% 78.9% 78.6% 78.3% 77.9% 77.3% 76.2% 76.0% 4 17 28 47 50 55 60 71 78 89 92 1 2 3 4 5 6 7 8 9 10 11 Spring 2014 Credit Courses from California Community College Chancellor’s Data Mart Combined Rate = Average of Retention and Success Rates Retention and Success Comparisons—California #4 in California for Combined Score Taft Feather River Lake Tahoe Crafton Hills Foothill Sequoias Santa Barbara Gavilan Ohlone Mendocino Napa Deanza Enrollment Count 14,265 5,038 5,387 14,372 28,511 34,642 56,366 13,221 23,437 8,769 16,116 49,916 Retention Rate 94.2% 94.4% 90.1% 91.0% 88.9% 91.0% 90.4% 88.0% 87.2% 89.1% 89.9% 88.4% Success Rate 82.2% 77.6% 76.8% 74.0% 75.9% 73.7% 74.2% 75.8% 76.6% 74.7% 73.7% 75.2% Combined Rate 88.2% 86.0% 83.5% 82.5% 82.4% 82.3% 82.3% 81.9% 81.9% 81.9% 81.8% 81.8% CA Rank 1 2 3 4 5 6 7 8 9 10 11 12 Spring 2014 Credit Courses from California Community College Chancellor’s Data Mart Combined Rate = Average of Retention and Success Rates Completion Trend and Comparisons Degree/Certificate Completion 600 Completion Rate 552 Chaffey Mt. San Jacinto San Bernardino Victor Valley Riverside Norco College Copper Mountain Crafton Hills Desert Moreno Valley Palo Verde 500 400 300 200 100 0 YR10/11 YR11/12 YR12/13 YR13/14 CA IE Rank Rank 11 1 29 2 35 3 37 4 49 5 50 6 54 7 55 8 69 9 87 10 111 11 To be IE #1 and CA top 10 we need ~820 grads 2013-2014 Degree and Chancellor Approved Certificate Completion From California Community College Chancellor’s Data Mart Rate = #of Degree/Certificate Completers/Enrolled Students Support Students and Build Community 3 Peaks Challenge Encourage students to summit three peaks: Engage, Learn and Advance. Love Do what these people encouraged . . . Build community around love.


