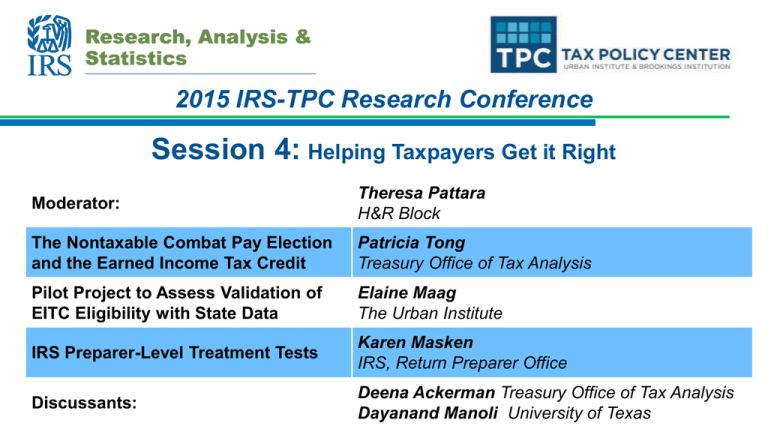
Session 4: 2015 IRS-TPC Research Conference Helping Taxpayers Get it Right
advertisement

2015 IRS-TPC Research Conference Session 4: Helping Taxpayers Get it Right Moderator: Theresa Pattara H&R Block The Nontaxable Combat Pay Election and the Earned Income Tax Credit Patricia Tong Treasury Office of Tax Analysis Pilot Project to Assess Validation of EITC Eligibility with State Data Elaine Maag The Urban Institute IRS Preparer-Level Treatment Tests Karen Masken IRS, Return Preparer Office Discussants: Deena Ackerman Treasury Office of Tax Analysis Dayanand Manoli University of Texas The Nontaxable Combat Pay Election and the EITC Suzanne Gleason and Patricia K. Tong IRS-TPC Research Conference June 18, 2015 *These views are the authors and do not necessarily reflect those of the U.S. Department of the Treasury or the U.S Department of Defense. 2 Background • Combat zone tax exclusion: Military service members do not pay income taxes on any income received in any month in which they spent time in a combat zone. – Capped at $88,416 in 2009. • Earned income tax credit (EITC) is calculated based on earnings. • Exclusion of combat zone earnings will reduce the EITC among some low-income military members. 3 2009 EITC for Married Filing Jointly Couple with 2 Qualifying Children 4 Nontaxable Combat Pay Election (NCPE) • Created in tax year 2004. • Gives service members the option to include nontaxable combat pay in EITC earnings. • Default setting is to exclude nontaxable combat pay. • NCPE gives military personnel the option to include or exclude all of their nontaxable combat pay. 5 Questions • Do military service members optimize their EITC? • Do observable characteristics differ between optimizers and nonoptimizers? • To what extent are service members eligible for the EITC because of the combat zone tax exclusion? • Do observable characteristics differ between those who are newly eligible and always eligible? • What is the cost of the nontaxable combat pay election? 6 Motivation • Federal income tax system has become more complex as policy makers continue to use taxes to provide income support and incentivize certain behaviors. • To what extent do targeted populations understand how to correctly claim credits on their own or is a tax preparer necessary? • Evidence that people do not understand the relationship between earned income and EITC (Chetty and Saez, 2013). 7 Data • Merge individual level military personnel characteristics from the Department of Defense to IRS tax return and W-2 data for tax years 2005-2009. • Restrict data to EITC-eligible military service members with nontaxable combat pay reported on their W-2s. – EITC-eligible includes all individuals who are eligible when combat pay is excluded from EITC earned income – Almost 1 million individuals – Represents 30% of service members with nontaxable combat pay. 8 EITC Optimization • Calculate EITC earned income both with and without nontaxable combat pay and compare amounts to IRS reported EITC earned income. • Calculate EITC both with and without nontaxable combat pay to determine optimal amount. • 82% optimize EITC. Should Use NCPE Should Not Use NCPE Use NCPE 45,909 (4.6%) 9,514 Do Not Use NCPE 18,490 (1.9%) 913,454 (92.5%) (1%) 9 Summary Statistics by EITC Optimization • Distributions by service and pay grade are similar. • On average, non-optimizers are older, more likely to file as unmarried, and have lower AGI than optimizers. • Among non-optimizers, 62% are filers who do not claim EITC, 31% are non-filers, 4% claim EITC and use the NCPE, 3% claim EITC and do not use the NCPE. Non-optimizers Optimizers Adjusted Gross Income $12,127 (14,047) $17,522 (10,756) Nontaxable Combat Pay $23,635 (16,004) $21,887 (14,970) 0.60 (0.49) Paid Preparer 0.28 (0.45) Notes: In millions of 2009 dollars 10 Do military service members optimize their EITC? Optimization Rate Average Loss Among Non-Optimizers Use a Paid Tax Preparer All Should Use NCPE Should Not Use NCPE 82% 71% 83% $1,191 $1,571 $1,145 54% 57% 54% 73% 54% 74% $1,232 $1,769 $1,171 91% 84% 91% $1,083 $1,123 $1,077 987,454 64,399 922,968 6.52% 93.47% Optimization Rate By Paid Preparer Use: No Paid Tax Preparer Average Loss Among Non-Optimizers Yes Paid Tax Preparer Average Loss Among Non-Optimizers Observations Percentage 11 Distribution of Personnel Who Do Not Optimize the EITC by Size of EITC Loss All Non-Optimizers EITC Loss≤100 100<EITC Loss≤500 500<EITC Loss≤1000 1000<EITC Loss≤2000 2000<EITC Loss Observations 12% 47% 5% 10% 30% 172,808 EITC Claimants 13% 31% 21% 23% 12% 12,011 Non-EITC Claimants Filers 13% 53% 4% 8% 21% 106,637 Non-Filers 8% 38% 4% 11% 39% 54,160 Excluding those with EITC Loss ≤ $500: o Reduces sample by over 100K o Increases optimization rate from 82% to 92% o Disparity in optimization rate by those who should (79%) and should not use the NCPE (93%) increases. 12 EITC Eligibility • Always Eligible if individual qualifies even if combat pay were required to be included in EITC earned income. – Includes those with zero taxable earnings. • Newly Eligible if individual would not qualify if combat pay were required to be included in EITC earned income. • 56% are Newly Eligible. 13 Summary Statistics by Always and Newly Eligible Always Eligible Newly Eligible Optimize EITC 0.87 (0.34) 0.79 (0.41) Use NCPE 0.13 (0.33) 0.00 (0.03) Age 27.97 (5.71) 32.14 (6.75) Single 0.07 (0.26) 0.26 (0.44) Any EITC Kids 0.97 (0.16) 0.60 (0.49) Claim EITC 0.90 (0.30) 0.79 (0.41) EITC $2,902 (1,399) $1,335 (1,482) Nontaxable Combat Pay $13,867 (8,894) $28,658 (15,869) Observations 431,590 555,777 14 Cost Estimates Total Cost of NCPE Total Cost of Combat Zone Tax Exclusion 2005 2006 2007 2008 2009 9.3 7.2 8.0 9.6 15.1 3,500 3,400 3,900 3,800 3,600 Notes: In millions of 2009 dollars • Total Cost of NCPE is the difference between the EITC claimed with the inclusion of combat pay and the amount of EITC that would have been claimed if nontaxable combat pay were excluded from EITC earned income: – Restricted to individuals who use the NCPE. • The cost of the NCPE represents <1% of the total cost of the Combat Zone Tax Exclusion. 15 Conclusion • 82% optimize EITC. • Optimization rates are lower for those who should use the NCPE. These differences remain when conditioning on paid tax preparer use and are larger among those who do not use a paid tax preparer. • The combat zone tax exclusion increases EITC eligibility. • NCPE cost is <1% of the total cost of the combat zone tax exclusion in any given year between 2005-2009. • The NCPE increases complexity in the tax code while the segment of the military population who benefits from the NCPE is small. 16 Using Supplemental Nutrition Assistance Program Data in EITC Administration June 18, 2015 Elaine Maag IRS-TPC Research Conference Background Goal: Reduce improper payments of EITC claims In 2007, 21.2-25.8% of EITC payments estimated to be overclaims; $13.7 - $16.7 billion Leading cause when type of error is known is claiming non-qualified child Can state benefit program data help reduce improper payments? www.taxpolicycenter.org 18 Key EITC Qualifying Elements Marital Status Income Relationship Residency Citizenship Status Student Disability 19 Description of EITC www.taxpolicycenter.org 20 Description of SNAP Table 1. SNAP Income Test October 1, 2014 through September 30, 2015 Household Size Gross Monthly Income (130 percent of federal poverty level) Net Monthly Income (100 percent of federal poverty level) $1,265 $973 1,705 1,311 2,144 1,650 +440 +339 1 2 3 Each additional member Source: USDA Food and Nutrition Services, http://www.fns.usda.gov/snap/eligibility#Income, 2015. www.taxpolicycenter.org 21 Why SNAP Data Might be Helpful Some overlap in recipients anticipated – But…some SNAP beneficiaries have no earnings – And…EITC provides benefits to some people with higher incomes than SNAP allows SNAP benefits based on the group of people who share meals – Can include multiple tax units – SNAP applicants and beneficiaries report living arrangements and relationships to other household members www.taxpolicycenter.org 22 Problem with SNAP data Recertify only once or twice each year - We assume if we observe a household that looks the same in two periods, we assume it looked that way in the intervening period. Monthly vs. annual data Timing inconsistent with tax year Self-reported www.taxpolicycenter.org 23 Tax units in Florida SNAP data All members 24% All adults, some children 2% Unmatched 50% www.taxpolicycenter.org All adults, no children 5% Childless EITC 8% No adults, some children Some adults 10% 1% 24 Residency Test: Families with Children All members 24% All adults, some children 2% 100% 80% All adults, no children 5% 60% 40% All children fail 20% 0% No children pass Full Match www.taxpolicycenter.org Missing 0 Child Children 25 Residency Test: Children Claimed by People Not in SNAP Unit 100% 80% No adults, some children 10% 60% 40% All children fail 20% 0% www.taxpolicycenter.org 26 Residency Test: Summary Some evidence that people claim different people on their tax returns than they report to SNAP offices – Observe adults in the data without children for at least 6 months – Observe children in the data with different adults for at least 6 months www.taxpolicycenter.org 27 “Childless” EITC Claims: Presence of Qualifying Child 100% 80% 60% 40% 20% Childless EITC 8% Some Evidence Insufficient information 0% www.taxpolicycenter.org 28 Outreach Some people in SNAP data with earnings don’t file tax return - Most have no earnings, are not citizens, or do not have a qualifying childre 11,600 adults appear eligible for the EITC for workers with children www.taxpolicycenter.org 29 Conclusion SNAP data can contribute to understanding residency during audit selection, but data are not of high enough quality to use in pre-refund math error authority - Must make assumptions about household stability - Most returns identified with SNAP data were already identified by IRS during audit selection www.taxpolicycenter.org 30 IRS Preparer-Level Treatment Tests Karen Masken June 18, 2015 31 Disclaimer The views expressed here are those of the author and do not necessarily represent the views of the IRS 32 Introduction • • • • • • • • Background Motivation Issues Addressed Preparer Selection Treatments Evaluation Technique Results Summary 33 Background • • • • In 2010, the Internal Revenue Service (IRS) adopted regulations aimed at establishing standards among tax return preparers. By January 1, 2011, preparers were required to register with the IRS in order to receive a preparer tax identification number (PTIN) and enter it on returns they prepare. The objective was to improve voluntary compliance by supporting the paid preparer community and providing oversight of the industry with the goal of reducing errors on tax returns. The Return Preparer Office (RPO) was formed to meet this objective. The three primary strategic goals of RPO are: 1. Register and promote a qualified tax professional community 2. Improve the compliance and accuracy of returns prepared by tax professionals 3. Support a stakeholder-focused culture that encourages voluntary compliance and continuous improvement 34 Background (cont.) In 2012 RPO implemented a multi-year study to test the effectiveness of various treatments in moving preparers and their clients toward greater voluntary compliance • Goals of the study – What types of treatments are cost effective – Is effectiveness persistent (recidivism) – Segmentation of preparers to minimize costs 35 Motivation Compliance Spectrum Compliant Those towards the compliant end of the spectrum might be moved by inexpensive light touches / nudges e.g., letters Noncompliant / Fraud Those towards the noncompliant end of the spectrum may require more expensive and intrusive treatments e.g., audits / injunctions 36 Motivation (cont.) • Scarce treatment resources • Little is known about the effectiveness of preparer-based treatments • Traditionally IRS has focused enforcement resources on the noncompliant / fraud end of the spectrum – These treatments are expensive – Finding less costly but effective treatments for those in the middle of the spectrum could have a significant impact on voluntary compliance • Relied on non-targeted services (e.g., tax forums, webinars, etc.) to nudge preparers to be more compliant 37 Issues Addressed • Schedule C Net Income – Schedule C accounts for almost 30% of Individual Income Tax gap (~$68 billion) – Around 75% of Schedule C returns are paid prepared – About 75% of paid prepared returns with Schedule C have errors • Additional Child Tax Credit (ACTC) – Emerging Issue, particularly children w/ ITINs – Around 65% of ACTC claims are paid prepared – ~1% of preparers responsible for 60% of children w/ ITINs 38 Preparer Selection: Schedule C • Error detection model developed using National Research Program (NRP) data • Modeled at the taxpayer level then rolled up to the preparer • Endogeneity issue led to decision to select preparers with majority of their Schedule C returns flagged by the model 39 Preparer Selection: ACTC • No error detection model development • Based on prevalence of ACTC returns • Children w/ ITINs: – At least 20 returns had ACTC children w/ ITINs – At least 15% of ACTC returns had children w/ITINs • General ACTC: – Did not meet above criteria – At least 20 returns had ACTC claims – Majority of returns had ACTC claims 40 Treatments: Schedule C First Year (1250 preparers in each treatment): 1. 2. 3. Educational visit by Revenue Agent Letter reminding preparers of due diligence requirements and warning they and or their clients may be audited Letter with same message of due diligence but also suggesting preparer take continuing education regarding Schedule C Second Year (1250 preparers in each treatment): 1. 2. 3. Educational Visit repeated Due Diligence Letter sent to subgroup Continuing Education Letter dropped 41 Treatments: ACTC 1. Educational letter explaining introduction of Schedule 8812 with emphasis on when children with ITINs qualify (3500 preparers) 2. Educational letter explaining introduction of Schedule 8812 (5000 preparers) 42 Evaluation Technique Difference in Differences used for both • Schedule C 1. Difference in success rate* before and after treatment 2. Difference between test and control groups * predefined as a 5 percentage point drop in returns selected • ACTC 1. Difference in ACTC claims before and after treatment 2. Difference between test and control groups 43 Results: Schedule C Percentage Point Difference Between Test and Control Groups: Success Rates Year 1 Educational Visit 12 Due Diligence Letter 7 Continuing Education Letter 8 Year 2 13 9 n.a. Percentage Point Difference Between Test and Control Groups: Recidivism Rates for Year 1 in Year 2 Educational Visit -6 Due Diligence Letter 2 Continuing Education Letter -1 44 Results: Schedule C (cont.) For Successful Test Group Preparers in Year 1: Number of Returns in 2013 Number of returns with Sch C Average percentage point decline in clients flagged Est. number of taxpayers moved toward voluntary compliance Educational Visit Due Diligence Letter Continuing Education Letter 140,900 113,000 123,800 37,000 31,200 32,000 19% 17% 18% 7,100 5,400 5,800 45 Results: ACTC Percentage Point Difference Between Test and Control Groups : Decline in Average Number ACTC Claims ACTC Children Claimed ACTC Children w/ ITINs ITIN Letter 4 5 10 General Letter 4 4 n.a. 46 Summary: Schedule C • All 3 treatments were found to be effective • Letters less effective overall but also much less costly • Results in year 2 are consistent with year 1 • Results in year 1 are persistent in year 2 (Recidivism non-apparent) 47 Summary: ACTC • Both treatments were found to be effective • An educational letter can be a cost-effective way to improve voluntary compliance • Targeted messaging, instead of expensive error detection models, can be a cost-effective way to improve voluntary compliance 48 2015 IRS-TPC Research Conference Session 4: Helping Taxpayers Get it Right Moderator: Theresa Pattara H&R Block The Nontaxable Combat Pay Election and the Earned Income Tax Credit Patricia Tong Treasury Office of Tax Analysis Pilot Project to Assess Validation of EITC Eligibility with State Data Elaine Maag The Urban Institute IRS Preparer-Level Treatment Tests Karen Masken IRS, Return Preparer Office Discussants: Deena Ackerman Treasury Office of Tax Analysis Dayanand Manoli University of Texas


