Fall 2011 Facts Student Enrollment
advertisement
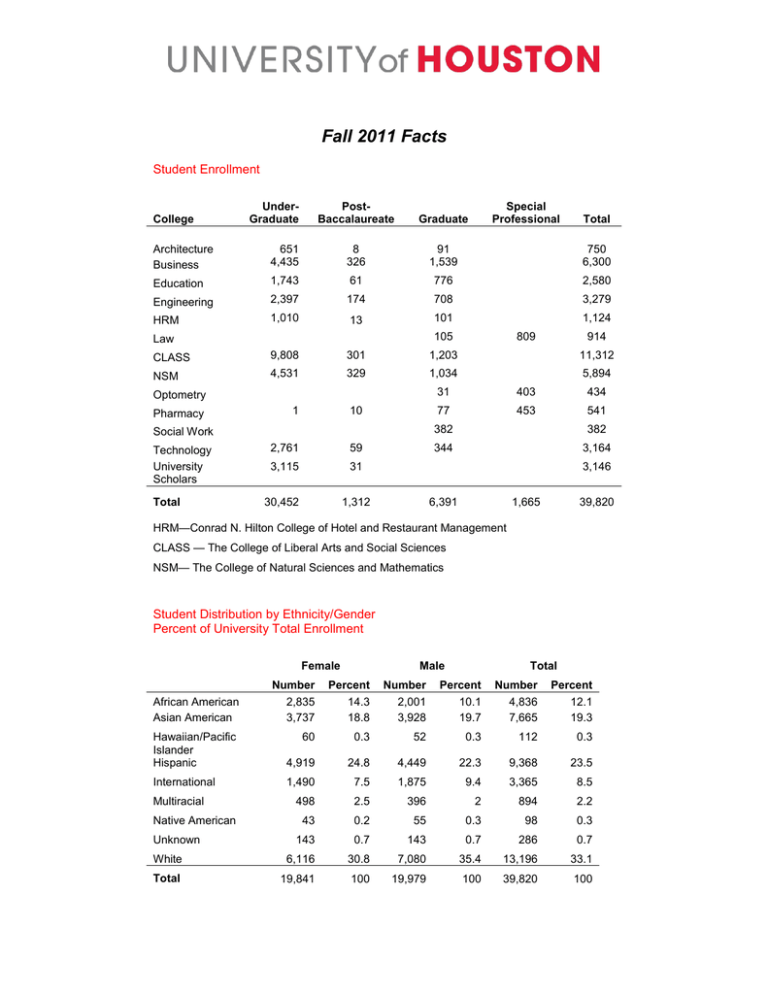
Fall 2011 Facts Student Enrollment College UnderGraduate PostBaccalaureate Graduate Special Professional Total Architecture Business 651 4,435 8 326 91 1,539 750 6,300 Education 1,743 61 776 2,580 Engineering 2,397 174 708 3,279 HRM 1,010 13 101 Law CLASS 9,808 301 1,203 NSM 4,531 329 1,034 Optometry Pharmacy 1 10 Social Work Technology University Scholars Total 1,124 105 2,761 59 3,115 31 30,452 1,312 809 914 11,312 5,894 31 403 434 77 453 541 382 382 344 3,164 3,146 6,391 1,665 39,820 HRM—Conrad N. Hilton College of Hotel and Restaurant Management CLASS — The College of Liberal Arts and Social Sciences NSM— The College of Natural Sciences and Mathematics Student Distribution by Ethnicity/Gender Percent of University Total Enrollment Female Male Total Number Percent Number Percent Number Percent African American Asian American 2,835 3,737 14.3 18.8 2,001 3,928 10.1 19.7 4,836 7,665 12.1 19.3 Hawaiian/Pacific Islander Hispanic 60 0.3 52 0.3 112 0.3 4,919 24.8 4,449 22.3 9,368 23.5 International 1,490 7.5 1,875 9.4 3,365 8.5 498 2.5 396 2 894 2.2 43 0.2 55 0.3 98 0.3 143 0.7 143 0.7 286 0.7 White 6,116 30.8 7,080 35.4 13,196 33.1 Total 19,841 100 19,979 100 39,820 100 Multiracial Native American Unknown Fall 2011 Facts Student Distribution by Level Full-time/Part-time Status and Mean Age Total Full Time Part Time Mean Age Freshman 6,215 5,575 640 18.8 Sophomore 6,346 4,901 1,445 21 Junior 7,500 5,499 2,001 23.1 Senior 10,391 6,919 3,472 25.1 Subtotal 30,452 22,894 7,558 22.5 1,312 319 993 30.6 Masters 4,499 2,688 1,811 28.9 Doctoral 1,892 1,456 436 31.1 Subtotal 6,391 4,144 2,247 29.6 1,665 1,480 185 25.8 39,820 28,837 10,983 24 Undergraduate Post-baccalaureate Subtotal Graduate Special Professional Subtotal Total Student Residency Number Percent Harris County 22,440 56.4 Adjacent Counties 8,609 21.6 Other Texas Counties 4,422 11.1 Subtotal Texas 35,471 89.1 Out-of-State 984 2.5 International 3,365 8.5 4,349 10.9 39,820 100 Texas Subtotal Non Resident Total Top 10 Places of Student Origin Texas County Harris Total 22440 State California Total 115 Country China Total 695 Fort Bend 5180 Louisiana 78 India 681 Brazoria 1222 Pennsylvania 51 Viet Nam 249 Galveston 1025 New York 50 Korea, Republic of 155 121 Montgomery 962 Florida 48 Nigeria Dallas 622 Illinois 43 Venezuela 93 Tarrant 400 Michigan 36 Mexico 91 Travis 393 Virginia 32 Saudi Arabia 86 Bexar 326 Georgia 30 Turkey 82 Houston 303 Oklahoma 29 Taiwan 74 Degrees Awarded Fiscal Year 2011 College Architecture Special Professional Bachelor 128 Masters 34 Doctoral 1,097 604 8 1,709 Education 369 170 76 615 Engineering 248 257 52 557 HRM 262 35 Business Admin. CLASS NSM 306 66 519 146 77 27 Social Work Technology Total 282 2,025 371 2,397 742 7 102 109 22 15 126 190 154 5 Optometry Pharmacy 297 89 Law Total 162 417 110 5,092 1,927 159 527 306 510 HRM—Conrad N. Hilton College of Hotel and Restaurant Management CLASS — The College of Liberal Arts and Social Sciences NSM— The College of Natural Sciences and Mathematics 7,835 Fall 2011 Facts Degrees Awarded By Ethnicity and Gender Fiscal Year 2011 Percent of Total Degrees Female Male Total Number Percent Number Percent Number Percent African American 509 12 255 7 764 10 Asian American 776 19 651 18 1,427 18 Hawaiian/Pacific Islander 13 0 14 0 27 0 Hispanic 861 21 633 17 1,494 19 International 403 10 551 15 954 12 Multiracial 52 1 40 1 92 1 Native American 13 0 15 0 28 0 Unknown 35 1 36 1 71 1 White 1,510 36 1,468 40 2,978 38 Total 4,172 100 3,663 100 7,835 100 Faculty Distribution RANKED Professor 431 Associate Professor 316 Assistant Professor 214 Subtotal 961 Non Ranked Other Faculty (Lecturer, Visiting, Adjunct) 1,143 Student Teaching Assistant Total 1,342 3,446 Ranked Faculty by Ethnicity/Gender Percent of Total Ranked Faculty Female Male All Number Percent Number Percent Number Percent African American 11 4 16 2 27 3 Asian American 55 19 105 16 160 17 Hispanic 26 9 35 5 61 6 International 11 4 24 4 35 4 Multiracial 1 0 3 0 4 0 4 1 4 0 White 186 64 484 72 670 70 Total 290 100 671 100 961 100 Native American 2011 – 2012 Tuition and Mandatory Fees Tuition is calculated according to residence status and total semester hours. Tuition and mandatory student fees quoted below are subject to change by University or Legislative action. Fees quoted below are subject to change by University or legislative action. (Figures do not include parking, lab and other fees.) Full-time Annual Tuition & Mandatory Fees: 1 Graduate Texas Resident 7,512 9,320 Non-Resident 15,024 14,954 Part-time Annual Tuition & Mandatory Fees: 3 Undergraduate 4,115 6,453 Non-Resident 7,871 $10,209 Based on 24 semester credit hours per academic year. Based on 18 semester credit hours per academic year. 3 Based on 12 semester credit hours per academic year. 2 Graduate Texas Resident Notes: 1 2 Undergraduate 3
