How Large Are Tax
advertisement

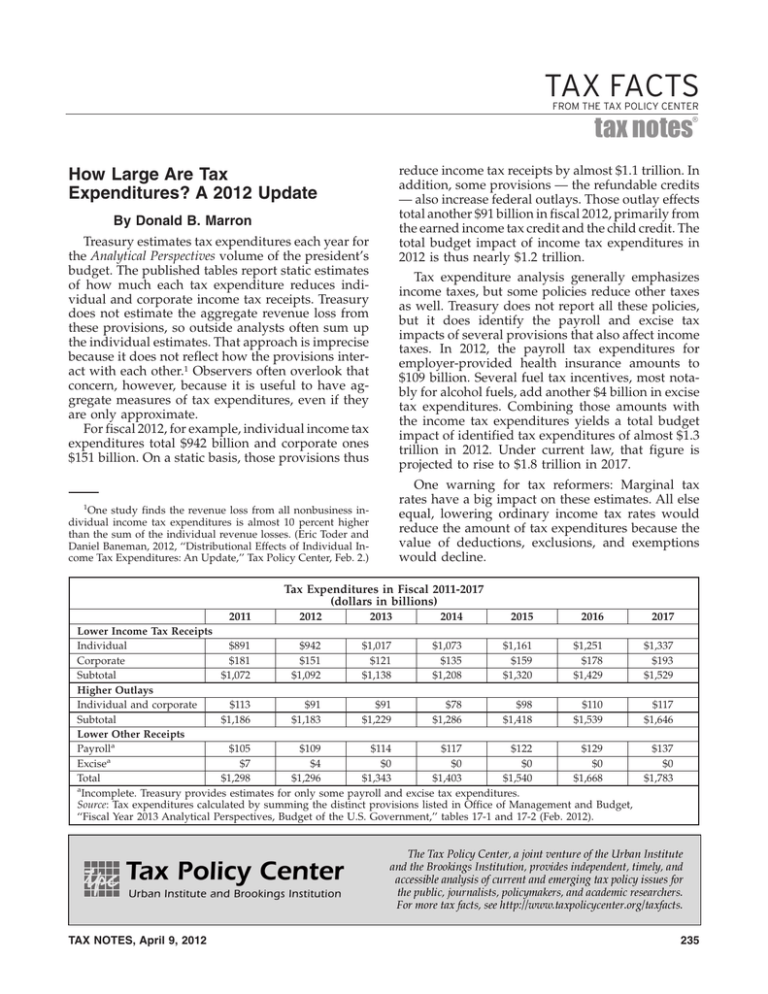
TAX FACTS FROM THE TAX POLICY CENTER ® tax notes reduce income tax receipts by almost $1.1 trillion. In addition, some provisions — the refundable credits — also increase federal outlays. Those outlay effects total another $91 billion in fiscal 2012, primarily from the earned income tax credit and the child credit. The total budget impact of income tax expenditures in 2012 is thus nearly $1.2 trillion. How Large Are Tax Expenditures? A 2012 Update By Donald B. Marron Treasury estimates tax expenditures each year for the Analytical Perspectives volume of the president’s budget. The published tables report static estimates of how much each tax expenditure reduces individual and corporate income tax receipts. Treasury does not estimate the aggregate revenue loss from these provisions, so outside analysts often sum up the individual estimates. That approach is imprecise because it does not reflect how the provisions interact with each other.1 Observers often overlook that concern, however, because it is useful to have aggregate measures of tax expenditures, even if they are only approximate. For fiscal 2012, for example, individual income tax expenditures total $942 billion and corporate ones $151 billion. On a static basis, those provisions thus Tax expenditure analysis generally emphasizes income taxes, but some policies reduce other taxes as well. Treasury does not report all these policies, but it does identify the payroll and excise tax impacts of several provisions that also affect income taxes. In 2012, the payroll tax expenditures for employer-provided health insurance amounts to $109 billion. Several fuel tax incentives, most notably for alcohol fuels, add another $4 billion in excise tax expenditures. Combining those amounts with the income tax expenditures yields a total budget impact of identified tax expenditures of almost $1.3 trillion in 2012. Under current law, that figure is projected to rise to $1.8 trillion in 2017. One warning for tax reformers: Marginal tax rates have a big impact on these estimates. All else equal, lowering ordinary income tax rates would reduce the amount of tax expenditures because the value of deductions, exclusions, and exemptions would decline. 1 One study finds the revenue loss from all nonbusiness individual income tax expenditures is almost 10 percent higher than the sum of the individual revenue losses. (Eric Toder and Daniel Baneman, 2012, ‘‘Distributional Effects of Individual Income Tax Expenditures: An Update,’’ Tax Policy Center, Feb. 2.) Tax Expenditures in Fiscal 2011-2017 (dollars in billions) 2011 2012 2013 2014 2015 2016 Lower Income Tax Receipts Individual $891 $942 $1,017 $1,073 $1,161 $1,251 Corporate $181 $151 $121 $135 $159 $178 Subtotal $1,072 $1,092 $1,138 $1,208 $1,320 $1,429 Higher Outlays Individual and corporate $113 $91 $91 $78 $98 $110 Subtotal $1,186 $1,183 $1,229 $1,286 $1,418 $1,539 Lower Other Receipts Payrolla $105 $109 $114 $117 $122 $129 $7 $4 $0 $0 $0 $0 Excisea Total $1,298 $1,296 $1,343 $1,403 $1,540 $1,668 a Incomplete. Treasury provides estimates for only some payroll and excise tax expenditures. Source: Tax expenditures calculated by summing the distinct provisions listed in Office of Management and Budget, ‘‘Fiscal Year 2013 Analytical Perspectives, Budget of the U.S. Government,’’ tables 17-1 and 17-2 (Feb. 2012). TAX NOTES, April 9, 2012 2017 $1,337 $193 $1,529 $117 $1,646 $137 $0 $1,783 235


