5.1 Graphing Quadratic Functions
advertisement
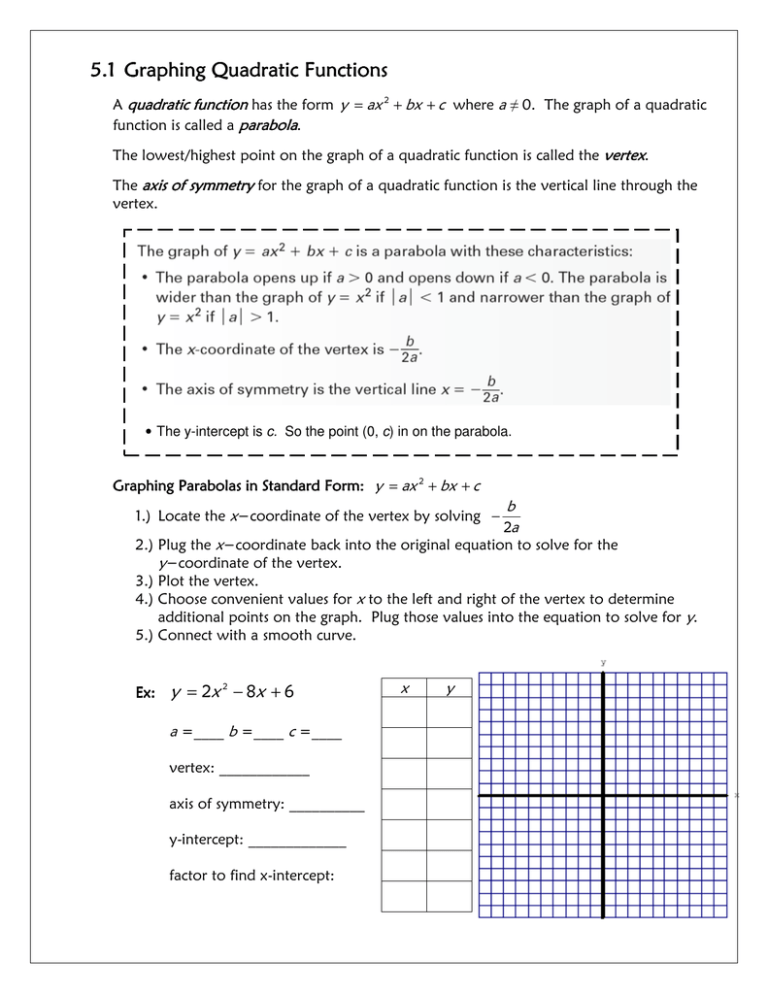
5.1 Graphing Quadratic Functions A quadratic function has the form y = ax 2 + bx + c where a ≠ 0. The graph of a quadratic function is called a parabola. The lowest/highest point on the graph of a quadratic function is called the vertex. The axis of ssymmetry ymmetry for the graph of a quadratic function is the vertical line through the vertex. • The y-intercept is c. So the point (0, c) in on the parabola. Graphing Parabolas in Standard Form: y = ax 2 + bx + c 1.) Locate the x−coordinate of the vertex by solving − b 2a 2.) Plug the x−coordinate back into the original equation to solve for the y−coordinate of the vertex. 3.) Plot the vertex. 4.) Choose convenient values for x to the left and right of the vertex to determine additional points on the graph. Plug those values into the equation to solve for y. 5.) Connect with a smooth curve. Ex: Ex: y = 2x 2 − 8x + 6 a =____ b =____ c =____ vertex: ____________ axis of symmetry: __________ y-intercept: _____________ factor to find x-intercept: x y Ex: Ex: y = −x 2 + x + 12 x y x y a =____ b =____ c =____ vertex: ____________ axis of symmetry: __________ y-intercept: _____________ factor to find x-intercept: Ex: 1 2 y = x2 −8 a =____ b =____ c =____ vertex: ____________ axis of symmetry: __________ y-intercept: _____________ factor to find x-intercept: Minimum & Maximum Values For y = ax 2 + bx + c , the vertex’s y−coordinate is the minimum value of the function if a > 0 and the maximum value if a < 0. Intercept Form: Form y = a( x − p )( x − q ) 1.) Locate the x−intercepts. The x−intercepts are at “p” and “q”. Because of the subtraction sign in the Intercept Form, you can simply find the opposite of the numbers for p and q in the equation. For example: for y = ( x + 1)( x − 7) , the intercepts are x = −1 and x = 7. 2.) Plot the x−intercepts on the x−axis. 3.) Find the average of the two intercepts, which will be the x−coordinate of the vertex. Substitute the x−value for the vertex into the equation to find the y−coordinate. Plot that point. 4.) Connect with a smooth curve. Ex: 1 2 y = − (x − 2)(x + 4) x y x y a =____ b =____ c =____ vertex: ____________ axis of symmetry: __________ y-intercept: _____________ x-intercepts: Ex: Ex: y = (x + 1)(x − 5) a =____ b =____ c =____ vertex: ____________ axis of symmetry: __________ y-intercept: _____________ x-intercepts:
