Activity 4. World Economic Situation and Prospects Source Task:
advertisement
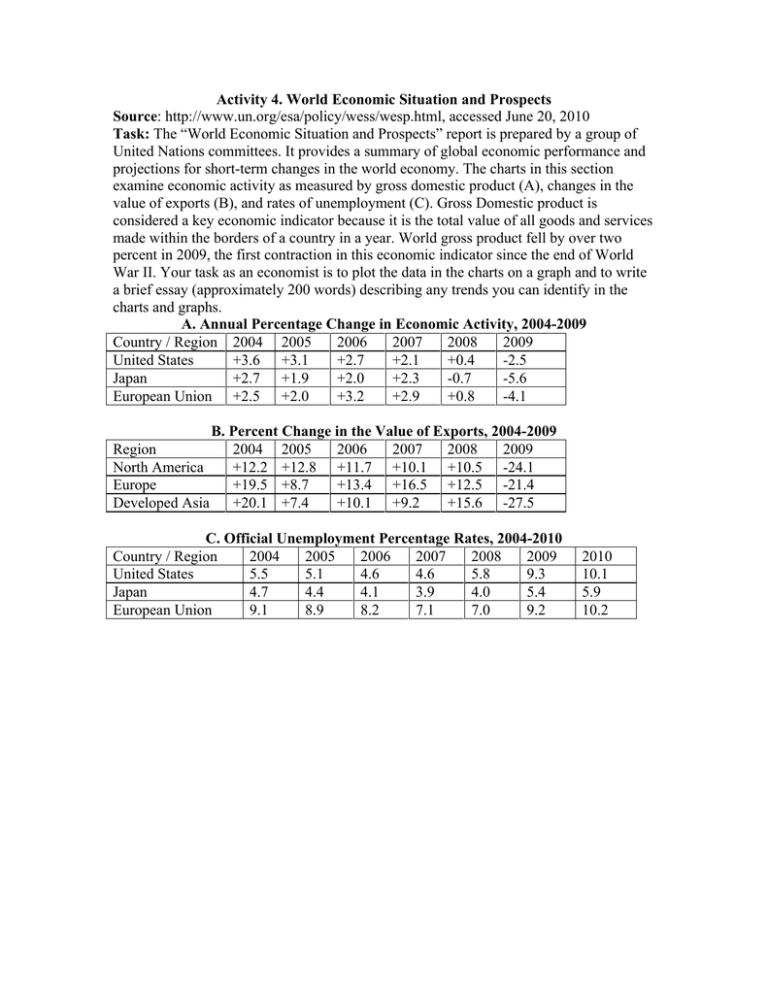
Activity 4. World Economic Situation and Prospects Source: http://www.un.org/esa/policy/wess/wesp.html, accessed June 20, 2010 Task: The “World Economic Situation and Prospects” report is prepared by a group of United Nations committees. It provides a summary of global economic performance and projections for short-term changes in the world economy. The charts in this section examine economic activity as measured by gross domestic product (A), changes in the value of exports (B), and rates of unemployment (C). Gross Domestic product is considered a key economic indicator because it is the total value of all goods and services made within the borders of a country in a year. World gross product fell by over two percent in 2009, the first contraction in this economic indicator since the end of World War II. Your task as an economist is to plot the data in the charts on a graph and to write a brief essay (approximately 200 words) describing any trends you can identify in the charts and graphs. A. Annual Percentage Change in Economic Activity, 2004-2009 Country / Region 2004 2005 2006 2007 2008 2009 United States +3.6 +3.1 +2.7 +2.1 +0.4 -2.5 Japan +2.7 +1.9 +2.0 +2.3 -0.7 -5.6 European Union +2.5 +2.0 +3.2 +2.9 +0.8 -4.1 B. Percent Change in the Value of Exports, 2004-2009 Region 2004 2005 2006 2007 2008 2009 North America +12.2 +12.8 +11.7 +10.1 +10.5 -24.1 Europe +19.5 +8.7 +13.4 +16.5 +12.5 -21.4 Developed Asia +20.1 +7.4 +10.1 +9.2 +15.6 -27.5 C. Official Unemployment Percentage Rates, 2004-2010 Country / Region 2004 2005 2006 2007 2008 2009 United States 5.5 5.1 4.6 4.6 5.8 9.3 Japan 4.7 4.4 4.1 3.9 4.0 5.4 European Union 9.1 8.9 8.2 7.1 7.0 9.2 2010 10.1 5.9 10.2
