Hydrodynamic and Mass Transfer Characteristics of Annulus-Rising Airlift
advertisement
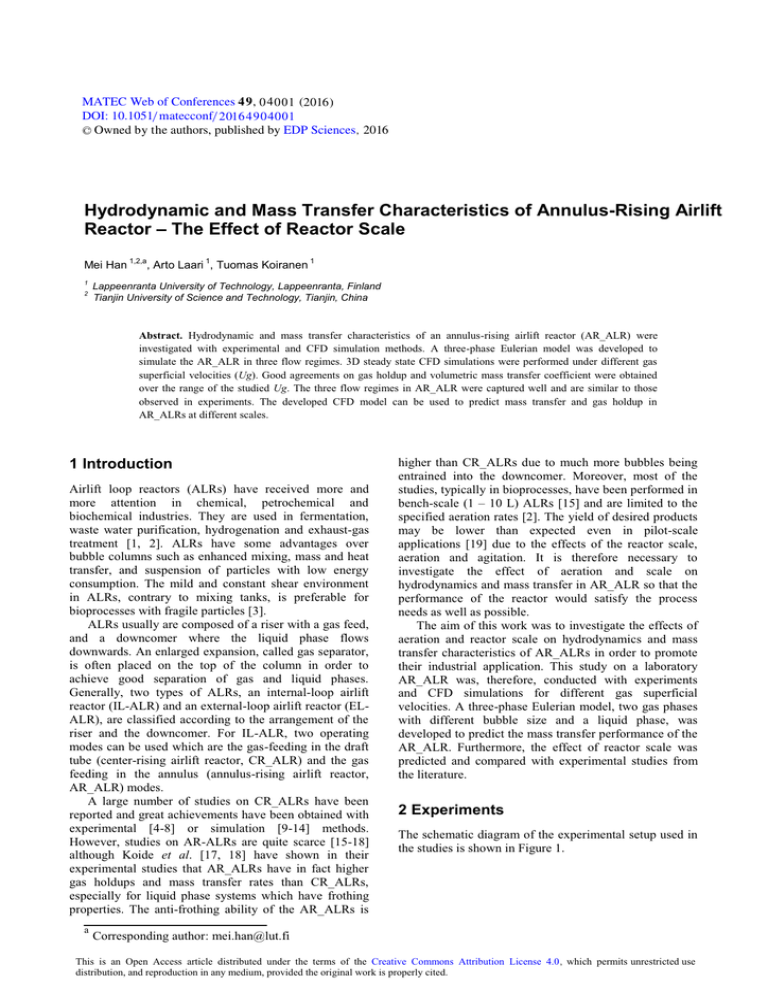
MATEC Web of Conferences 4 9 , 0 4 0 01 (2016 ) DOI: 10.1051/ m atecconf/ 2016 4 9 0 4 0 01 C Owned by the authors, published by EDP Sciences, 2016 Hydrodynamic and Mass Transfer Characteristics of Annulus-Rising Airlift Reactor – The Effect of Reactor Scale Mei Han 1 2 1,2,a 1 , Arto Laari , Tuomas Koiranen 1 Lappeenranta University of Technology, Lappeenranta, Finland Tianjin University of Science and Technology, Tianjin, China Abstract. Hydrodynamic and mass transfer characteristics of an annulus-rising airlift reactor (AR_ALR) were investigated with experimental and CFD simulation methods. A three-phase Eulerian model was developed to simulate the AR_ALR in three flow regimes. 3D steady state CFD simulations were performed under different gas superficial velocities (Ug). Good agreements on gas holdup and volumetric mass transfer coefficient were obtained over the range of the studied Ug. The three flow regimes in AR_ALR were captured well and are similar to those observed in experiments. The developed CFD model can be used to predict mass transfer and gas holdup in AR_ALRs at different scales. 1 Introduction Airlift loop reactors (ALRs) have received more and more attention in chemical, petrochemical and biochemical industries. They are used in fermentation, waste water purification, hydrogenation and exhaust-gas treatment [1, 2]. ALRs have some advantages over bubble columns such as enhanced mixing, mass and heat transfer, and suspension of particles with low energy consumption. The mild and constant shear environment in ALRs, contrary to mixing tanks, is preferable for bioprocesses with fragile particles [3]. ALRs usually are composed of a riser with a gas feed, and a downcomer where the liquid phase flows downwards. An enlarged expansion, called gas separator, is often placed on the top of the column in order to achieve good separation of gas and liquid phases. Generally, two types of ALRs, an internal-loop airlift reactor (IL-ALR) and an external-loop airlift reactor (ELALR), are classified according to the arrangement of the riser and the downcomer. For IL-ALR, two operating modes can be used which are the gas-feeding in the draft tube (center-rising airlift reactor, CR_ALR) and the gas feeding in the annulus (annulus-rising airlift reactor, AR_ALR) modes. A large number of studies on CR_ALRs have been reported and great achievements have been obtained with experimental [4-8] or simulation [9-14] methods. However, studies on AR-ALRs are quite scarce [15-18] although Koide et al. [17, 18] have shown in their experimental studies that AR_ALRs have in fact higher gas holdups and mass transfer rates than CR_ALRs, especially for liquid phase systems which have frothing properties. The anti-frothing ability of the AR_ALRs is a higher than CR_ALRs due to much more bubbles being entrained into the downcomer. Moreover, most of the studies, typically in bioprocesses, have been performed in bench-scale (1 – 10 L) ALRs [15] and are limited to the specified aeration rates [2]. The yield of desired products may be lower than expected even in pilot-scale applications [19] due to the effects of the reactor scale, aeration and agitation. It is therefore necessary to investigate the effect of aeration and scale on hydrodynamics and mass transfer in AR_ALR so that the performance of the reactor would satisfy the process needs as well as possible. The aim of this work was to investigate the effects of aeration and reactor scale on hydrodynamics and mass transfer characteristics of AR_ALRs in order to promote their industrial application. This study on a laboratory AR_ALR was, therefore, conducted with experiments and CFD simulations for different gas superficial velocities. A three-phase Eulerian model, two gas phases with different bubble size and a liquid phase, was developed to predict the mass transfer performance of the AR_ALR. Furthermore, the effect of reactor scale was predicted and compared with experimental studies from the literature. 2 Experiments The schematic diagram of the experimental setup used in the studies is shown in Figure 1. Corresponding author: mei.han@lut.fi This is an Open Access article distributed under the terms of the Creative Commons Attribution License 4.0, which permits XQUHVWULFWHGXVH distribution, and reproduction in any medium, provided the original work is properly cited. MATEC Web of Conferences monitored and recorded using a MARVET BASIC 2000 Dissolved Oxygen Meter (Tallinn, Estonia) with the oxygen sensor located at 0.6 m above the gas distributor. Nitrogen was first sparged into the AR-ALR until the dissolved oxygen concentration was close to zero level and steady-state hydrodynamic conditions were reached. Then, nitrogen flow was shut down and compressed air feed was started. A pressure valve and a digital massflow controller were used to keep the nitrogen and the compressed air feeds at constant level in order not to interrupt the flow fields. Sufficient time was given in each experimental run to strip out the dissolved nitrogen and to saturate the liquid phase with oxygen to the maximum level. To calculate the volumetric oxygen mass transfer coefficient, it is assumed that the liquid phase is perfectly mixed and that oxygen depletion from the gas bubbles is negligible. The rate of oxygen dissolution in the liquid phase can be described by Eq. (2), 4 1 2 1 Riser 2 Downcomer (draft tube) 3 Ring distributor 4 Square tank 5 Gas flow rotameter 6 Compressor 3 5 6 Figure 1. Schematic diagram of the experimental setup The laboratory-scale AR_ALR consists of two cylinders made of acrylic resin with a thickness of 0.005 m. A plastic ring gas distributor with 36 pores of 0.5 mm diameter was installed at the annulus of the outer cylinder 0.07 m above the bottom. Table 1 gives the dimensions of the AR_ALR in details. Table 1. The dimensions of the AR_ALR. Dimension, m Riser Downcomer diameter 0.15 0.10 height 1.20 0.60 Compressed air was used as the dispersed phase and it was operated in once-through mode. Tap water was the continuous phase and it was used as a batch. The unaerated liquid height was 0.8 m. All the experiments were carried out at room temperature and atmospheric pressure. The operating gas superficial velocity, Ug, was calculated based on the cross-sectional area of the riser and is listed in Table 2. Table 2. The dimensions of the AR_ALR. Gas superficial velocity Ug (3) dCsensor dt ksensorCL Csensor where CL is the concentration of dissolved oxygen. In the experiments to determine the value of ksensor, two beakers with water saturated with nitrogen and oxygen were used, respectively. A value of 0.0625 1/s was obtained for the ksensor by making a regression of the Csensor/CL values versus time. Analytical solution of (2) along with the sensor dynamics given by Eq. (3), yields [21], Csensor C * 1 ksensor e kL aLt + k L aL e 0.65 1.18 1.74 ksensor kL aL ksensor kL aL (4) ksensor t The volumetric mass transfer coefficient per volume of the reactor can then be determined by Eq. (5): Value, cm/s 0.41 (2) dC L dt k L L C * C L where kLaL is the volumetric mass transfer coefficient per unit volume of liquid in the AR_ALR. CL is the dissolved-oxygen concentration in the liquid and C* is the oxygen saturation concentration at the gas-liquid interface. The sensor of the dissolved oxygen meter has a time constant, ksensor, corresponding to the delay in recording due to the inherently finite response time. The oxygen concentration value indicated by the sensor, Csensor satisfies [20], kL a kL aL 1 ag , overall (5) 2.55 3 Simulation The overall gas holdup, <ag,overall>, in the column was measured by the height expansion method and calculated by Eq. (1). a g ,overall H m H l H m (1) where Hm and Hl are the height of the mixture after aeration and the height of the liquid before aeration, respectively. The volumetric mass transfer coefficient, kLa, was determined by using a dynamic oxygen absorption method. The dissolved oxygen concentration was 3.1 Governing equations A three-phase Eulerian model was developed to simulate the hydrodynamics and mass transfer of AR-ALRs. This model includes two gas dispersed phases and one liquid continuous phase. Each gas phase has a uniform bubble size but a different bubble diameter value. The large bubble phase (g1) and the small bubble phase (g2) were defined according to measured bubble sizes. The diameter varies from 0.005 to 0.008 m for the large 04001-p.2 ICCCP 2016 combined film-penetration models. Huang et al. [13] compared several typical mass transfer models for one ALR and recommended the one time model proposed earlier by Cocke et al. [22] based on the penetration theory, as shown in Eq. (6). bubble class and from 0.001 to 0.003 m for the small bubble class corresponding to Ug. Interaction between g1 and g2 was not considered and no bubble coalescence or breakage was involved. The momentum transfer (Mk) between the gas phases and the liquid phase was formulated by taking the drag (FD, k), lift (FL, k), wall lubrication (FW, k) and turbulent dispersion forces (FT, k) into account. The turbulence of the liquid phase was resolved by the dispersed standard k - ɛ turbulent model. The governing equations are listed in Table 3 in detail. k L a 12 g d b Model k k u k 0, k l , g1, g 2 l l ul ul l P ' l eff ,l ul uTl l l g M l Momentum gi gi u gi u gi gi P ' gi eff , gi u gi uTgi 2 2 2 2 i 1 i 1 i 1 i 1 M l ( M g1 M g 2 ) FD, gi FL, gi FW , gi FT , gi FD, gi 3 4 gi l l CD, gi d gi u gi u l u gi u l CD , g1 max min 24 Re r , g1 1 0.15 Re0.687 r , g 1 , 72 Re r , g 1 , 8 3 Eog1 Eog1 4 CD , g 2 FL, gi 0.687 24 1 0.15 Re r , g 2 Re r , g 2 ,Re r , g 2 1000 0.44,Rer , g 2 1000 FL, gi CL, gi gi l u gi ul ul CL , gi min(0.288 tanh n(Re r , gi ), f ( Eogi )),Eogi 4 f Eogi , 4< Eogi 10 0.27,10< Eogi f ( Eogi ) 0.00105Eo'gi 3 0.0159Eo'gi 2 0.0204Eo'gi 0.474 FT, gi FW, gi FT , gi l CT l ,CT 0.1 FW , gi gi l (u slip , gi (u slip , gi nw )nw ) d gi max(CW 1 CW 2 d gi yW , 0),CW 1 0.01, CW 2 0.05 ( l l kl ul ) l lam,l ( tl tb ) / k kl l (Gk ,l l l ) l Sk ,l k-ε k L a g 2 d g1 12 g 2 d g 2 DLU slip, g1 d g1 (7) DLU slip, g 2 d g 2 (8) 3.3 Numerical details i g1, g 2 k L a g1 12 g1 gi gi g M gi FD, gi (6) Equation (7) and (8), in the current study, were employed to calculate the kLa between the liquid and each bubble phase, respectively. The overall kLa, the sum of (kLa)g1 (large bubble size class) and (kLa)g2 (small bubble size class), was validated against the experimental results. Table 3. The developed three-phase Eulerian model Item Continuity DLU slip d b ( l l l ul ) l lam,l ( tl tb ) / l l l (C 1Gk ,l C 2 l l ) l S ,l kl To reduce computational expense, one quarter of the 3dimensional AR_ALR was taken as the computational domain. The configuration of the AR_ALR was generated according to the experimental equipment. The velocity inlet boundary was applied to the upper face of the gas distributor, where the gas inlet velocity and its volume fraction were specified according to the experiments. On the top domain surface, pressure outlet boundary condition was set. The symmetry boundaries were used for the two symmetrical surfaces of the quarter of the AR_ALR. The boundary conditions were a nonslip condition for the liquid and gas phase on all the reactor walls. 3D steady state simulations were carried out with the commercial software ANSYS Fluent 14.5. For all the simulations, the phase-coupled SIMPLE algorithm was used for the solution of the pressure-velocity coupling. The second order upwind scheme was used for the momentum, turbulence kinetic energy and dissipation rate equations and the first-order scheme for the volume fraction equation. The residual convergence criterion for all the variables was set to 10-4. The mass balance of the gas phase and the volume-weighted average gas holdup for each case were additionally used to examine the convergence for all simulations. eff ,l lam,l tl , eff ,gi g l eff ,l 4 Result and discussion Cµ = 0.09; σk =1.00; σɛ =1.3; Cɛ1 = 1.44, Cɛ2 = 1.92 4.1 Mesh independence 3.2 Mass transfer model Mass transfer rate between gas and liquid phase is an important factor in multiphase reactor performance. Interfacial mass transfer is usually expressed by volumetric mass transfer coefficient kLa. Four different categories of mass transfer models have been reported in [13]. These are (1) phenomenological correlations and/or models; (2) spatial models; (3) time models and (4) The influence of the mesh size on the numerical solutions was examined with one coarse mesh case and another finer mesh. The coarse mesh had 43,824 hexahedron elements with the maximum edge size of 5 mm. The number of the cells of the fined one was 400,896 with the maximum edge size of 2.5 mm. The simulations were performed for both cases at gas superficial velocity Ug 1.18 cm/s. 04001-p.3 MATEC Web of Conferences The relative discrepancy between the coarse and the finer mesh cases is 1.58% for the overall gas holdup and 0.81% for the kLa. Figure 2 shows the radial profile of the axial liquid velocity for both cases, where the difference is around 10%. It can be seen that the coarse mesh is sufficient to obtain mesh independent solution. Therefore, it was used to conduct all the subsequent simulations. Axial liquid velocity, m/s 0.3 Coarse mesh Fine mesh 0.2 0.1 0 0.0 0.2 0.4 0.6 0.8 1.0 -0.1 (a) -0.2 (b) (c) Figure 4. Gas holdup profiles for three regimes: r/R (a) Ug =0.65 cm/s (b) Ug =1.18 cm/s (c) Ug =2.55 cm/s. Figure 2. Influence of mesh size on radial profile of axial liquid velocity 4.2 Simulation and validation of the lab-scale AR_ALR The simulated overall gas holdup agrees well with the experimental results over the range of the studied Ug, as shown in Figure 3. The overall gas holdup increases with the increase of Ug. The volumetric mass transfer coefficient was validated against the experimental results under different Ug, as shown in Figure 5. In overall, good agreement was obtained between the simulations and experiments although some discrepancy can be seen at Ug = 1.18 cm/s. This is probably caused by more complex hydrodynamic characteristics at the transition from homogeneous to heterogeneous flow. Volumetric mass trasnfer coefficient, 1/s -0.3 4.0 Overall gas holdup, % Experiment CFD 3.0 2.0 1.0 0.020 Experiment CFD 0.015 0.010 0.005 0.000 0.0 0.0 0.0 0.5 1.0 1.5 2.0 2.5 0.5 1.0 1.5 2.0 2.5 3.0 Gas superficial velocity, cm/s 3.0 Gas Superficial velocity, cm/s Figure 5. Mass transfer at different Ug : square-experiments; star-CFD. Figure 3. Overall gas holdup at different Ug : squareexperiments; star-CFD. Three flow regimes can be distinguished in ALRs depending how far the gas bubbles reach in the reactor. These are the “no gas entrainment” regime (regime I), “gas entrainment, but no recirculation” regime (regime II) and “complete gas recirculation” regime (regime III). As shown in Figure 4 (a), (b) and (c), all the three flow regimes, which were also observed in the experiments, were captured with the developed model at different gas superficial velocities. The local volumetric mass transfer coefficient from simulations is shown in Figure 6 for three different flow regimes. The maximum volumetric mass transfer coefficient appears at the inlet of the downcomer due to substantial accumulation of bubbles. It can be seen that the radial profile of kLa is ‘core-peaking’ in the riser and ‘wall-peaking’ in the downcomer (except for the case (a) of ‘no bubble entrained into the downcomer flow regime’), which is in accordance with the gas holdup profile also. Only small bubbles can be entrained further 04001-p.4 ICCCP 2016 into the downcomer. These small bubbles are located close to the wall of the downcomer. These results suggest that the developed three-phase Eulerian model can be used to accurately predict the hydrodynamics and mass transfer of the studied AR_ALR. as shown in Figure 8. As pointed out by van Baten et al. [23], the friction losses of liquid phase encountered in larger scale reactor are reduced and the liquid circulation velocity increases. For AR_ALR, much more bubbles could be entrained into the downcomer and therefore high gas holdup is predicted. In order to validate the developed CFD model, further simulations with the larger scale reactor were performed on two more high gas superficial velocities and compared with the experimental data from [24]. As shown in Figure 8, somewhat higher simulated gas holdup is, however, obtained probably due to absence of the enlarged gas separator part in the simulated AR_ALR. 12.0 Experiment (a) (b) Overall gas holdup, % Data from Deng et al. (c) CFD_Lab-scale 9.0 CFD_Scale-up 6.0 3.0 Figure 6. Mass transfer profiles for three regimes: (a) Ug =0.65 cm/s (b) Ug =1.18 cm/s (c) Ug =2.55 cm/s. 0.0 0.0 1.5 3.0 4.5 6.0 7.5 9.0 10.5 Gas superficial velocity, cm/s 4.3 The scale effect simulated by CFD Figure 8. Effect of reactor scale on overall gas holdup: squareexperiments; diamond-from [24]; star-CFD with laboratory scale AR_ALR; cross-scale-up AR_ALR. In Figure 9, the volumetric mass transfer coefficients obtained in simulations and experiments are compared in the two reactor scales. The simulated results with the larger scale reactor are higher than that of the laboratory scale reactor, which is in accordance with the predicted gas holdup. H4 The effect of reactor scale on the hydrodynamics and mass transfer of AR_ALR was investigated with CFD simulations. 3-D steady-state simulation was performed for an AR_ALR with a height of 4.5 m. The ratio of the cross-sectional area of the riser to that of the downcomer was maintained the same as in the laboratory AR_ALR. The dimension of the computational domain for the larger AR_ALR is shown in Figure 7. The number of the elements was 773,652 with the maximum edge of 5 mm. Volumetric mass transfer coefficient, % 0.040 Rd_i Rd_o Unit: m H3 H1= 0.25 H2= 0.02 H3= 3.50 H4= 0.75 R = 0.135 Rd_i= 0.09 Rd_o= 0.099 Experiment Data from Deng et al. CFD_Lab-scale 0.030 CFD_Scale-up 0.020 0.010 0.000 0.0 1.5 3.0 4.5 6.0 7.5 9.0 10.5 H1 H2 Gas superficial velocity, cm/s Figure 9. Effect of reactor scale on volumetric mass transfer coefficient: square-experiments; diamond-from [24]; star-CFD with laboratory scale AR_ALR; cross-scale-up AR_ALR. R Figure 7. Dimension of the scale-up AR_ALR. The The overall gas holdup simulated with the larger scale AR_ALR is higher than that of the laboratory scale, 5 Conclusion 04001-p.5 MATEC Web of Conferences Hydrodynamic characteristic and mass transfer performance of the annulus-rising airlift reactor were investigated with experimental and CFD simulation methods. The effects of superficial gas velocity and reactor scale are presented and compared with experimental results from literature. A three-phase Eulerian model was developed for simulating the AR_ALR. Good agreements on gas holdup and volumetric mass coefficient were obtained over the range of the studied gas superficial velocities. The three flow regimes observed in experiments in AR_ALR are also captured by the developed model. According to the comparison of experiments and simulations, the gas holdup and the volumetric mass transfer coefficients can be predicted well at different scales and gas superficial velocities using the three-phase Eulerian model with the proposed momentum terms. References 1. 2. 3. 4. 5. 6. 7. 8. 9. M. Y. Chisti, M. Moo-Young, Chem. Eng. Comm. 60, 47 (1987) R. Bannari, A. Bannari, P. Vermette, P. Proulx, Biotech. Bioeng. 109, 8 (2012) M. Y. Chisti, Airlift Bioreactors, London: Elsevier, 8-9 (1989) C. C. Fu, L. S. Fan, W. T. Wu, Chem. Eng. Tech., 30, 5 (2007) L. C. Shing, H. S. Jye, Chem. Eng. J. 91, 19 (2003) A. Fadavi, Y. Chisti, Chem. Eng. J. 131, 6 (2007) H. P. Luo, M. H. Al-Dahhan, Chem. Eng. Sci., 63, 11 (2008) P. M. Kilonzo, A. Margaritis, M. A. Bergougnou, J.T. Yu, Q. Ye, Biochem. Eng. J., 34, 9 (2007) Q. S. Huang, C. Yang, G. Z. Yu, Z. S. Mao, Chem. Eng. Tech., 30, 9 (2007) 10. M. Šimčík, A. Mota, M. C. Ruzicka, A. Vicente, J. Teixeira, Chem. Eng. Sci., 66, 11 (2011) 11. Q. S. Huang, C. Yang, G. Z. Yu, Z. S. Mao, Chem. Eng. Tech., 31, 8 (2008) 12. A. Sokolichin, G. Eigenberger, Chem. Eng. Sci., 49, 11 (1994) 13. Q. S. Huang, C. Yang, G. Z. Yu, Z. S. Mao, Chem. Eng. Sci., 65, 9 (2010) 14. H. P. Luo, M. H. Al-Dahhan, Chem. Eng. Sci., 30, 15 (2011) 15. E. R. Gouveia, C. O. Hokka, A. C. Badino-Jr, Brazil. J. of Chem. Eng., 20, 9 (2003) 16. S. L. Sun, C. J. Liu, W. S. Wei, X. J. Bao, Powder. Tech., 162, 6 (2006) 17. K. Koide, K. Kurematsu, S. Iwamoto, Y. Iwata, K. Horibe, J. Chem. Eng. Jap., 16, 6 (1983) 18. K. Koide, K. Kurematsu, S. Iwamoto, Y. Iwata, K. Horibe, J. Chem. Eng. Jap., 16, 6 (1983) 19. P. R. Lennartsson, C. Niklasson, M. J. Taherzadeh, Bioresour. Tech., 102, 7 (2011) 20. C. O. Vandu, R. Krishna, Chem. Eng. Process, 43, 8 (2004) 21. H. M. Letzel, J. C. Schouten, R. Krishna, C. M. van den Bleek, Chem. Eng. Sci., 54, 9 (1999) 22. A. Cockx., Z. D. Quang, J. M. Audic, A. Liné, M. Roustan, "Global and local mass transfer coefficients in the waste water treatment process by computational fluid dynamics," Chem. Eng. Process, 40, 7 (2001) 23. J. M. van Baten, J. Ellenberger, R. Krishna, "Hydrodynamics of internal air-lift reactors: experiments versus CFD simulations, Chem. Eng. Process, 42, 9 (2003) 24. Z. H. Deng, T. F. Wang, N. Zhang, Z. W. Wang, Chem. Eng. J. 160, 8 (2010) 04001-p.6
