Pushing%PET%Imaging%to%the% Cellular%Level:%Development%of%a% Radioluminescence%Microscope% %
advertisement
8/1/13%
Stanford University School of Medicine
Department of Radiation Oncology
Division of Radiation Physics
Pushing%PET%Imaging%to%the%
Cellular%Level:%Development%of%a%
Radioluminescence%Microscope%
!
Guillem!Pratx,!PhD!
Stanford%University%
432
Fig. 4 A 53-year-old woman
with T3 (52 mm) N0 left breast
invasive ductal carcinoma, SBR
grade 1, ER +++ , PR +++,
c-erbB-2−, p53 wild-type.
Tumour SUVmax is 2.5
%
Eur J Nucl Med Mol Imaging (2011) 38:426–435
AAPM%Annual%MeeFng%
Nanotechnology%&%Molecular%Imaging%
Thursday,%August%8th,%2013%
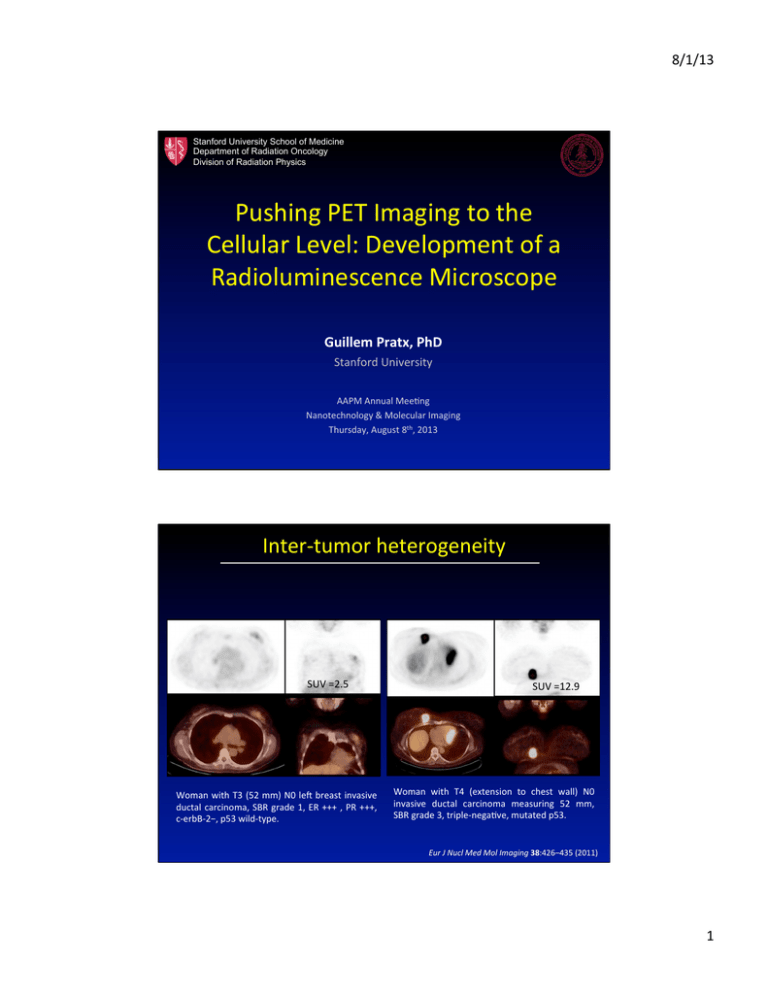
InterLtumor%heterogeneity%
mulation measured by IHC and p53 mutation detected by
sequencing has been estimated to be less than 75% [28].
The yeast functional assay that we used is robust and is
even more sensitive than direct sequencing [29].
Some explanations can be proposed for the high FDG
uptake in tumours with non-functional p53. Mutations of
432
Eur J Nucl Med Mol Imaging (2011) 38:426–435
Fig. 4 A 53-year-old woman
with T3 (52 mm) N0 left breast
invasive ductal carcinoma, SBR
grade 1, ER +++ , PR +++,
c-erbB-2−, p53 wild-type.
Tumour SUVmax is 2.5
Fig. 5 A 64-year-old woman
with T4 (extension to chest
wall) N0 invasive ductal
carcinoma measuring 52 mm,
SBR grade 3, triple-negative,
mutated p53. SUVmax of the
tumour is 12.9
SUV%=2.5%%
p53 were found to impair the repressive effect of p53 on
Woman%with%T3%(52%mm)%N0%leV%breast%invasive%
GLUT1 and GLUT4 gene promoters [30, 31]. Loss of
expression of TIGAR (TP53-induced glycolysis and apoductal%carcinoma,%SBR%grade%1,%ER%+++%,%PR%+++,%
ptosis regulator) in non-functional p53 tumours could also
cLerbBL2−,%p53%wildLtype.%%
explain high FDG uptake [32]. Finally, a recent (in vitro)
mulation measured by IHC and p53 mutation detected by
sequencing has been estimated to be less than 75% [28].
The yeast functional assay that we used is robust and is
even more sensitive than direct sequencing [29].
Some explanations can be proposed for the high FDG
uptake in tumours with non-functional p53. Mutations of
Fig. 5 A 64-year-old woman
with T4 (extension to chest
wall) N0 invasive ductal
carcinoma measuring 52 mm,
SBR grade 3, triple-negative,
mutated p53. SUVmax of the
tumour is 12.9
p53 were found to impair the repressive effect of p53 on
GLUT1 and GLUT4 gene promoters [30, 31]. Loss of
expression of TIGAR (TP53-induced glycolysis and apoptosis regulator) in non-functional p53 tumours could also
explain high FDG uptake [32]. Finally, a recent (in vitro)
study suggests that abrogation of p53 is associated with
SUV%=12.9%
Woman% with% T4% (extension% to% chest% wall)% N0%
invasive% ductal% carcinoma% measuring% 52% mm,%
SBR%grade%3,%tripleLnegaFve,%mutated%p53.%
study suggests that abrogation of p53 is associated with
Eur$J$Nucl$Med$Mol$Imaging$38:426–435%(2011)%
1%
8/1/13%
The%Standardized%Uptake%Value%
acFvity%in%
the%tumor%
mass%of%
the%tumor%
Tumor%
acFvity%in%
the%paFent%
mass%of%
the%paFent%
Tracer%Compartmental%Analysis%
K1$
K4$
FDGL6L%
phosphate%
FDG%
FDG%
HK!
K3$
HK!
K2$
Tumor%
2%
R3 (G4)
Tamar Danon1, Natalie Perzov1 & Uri Alon1
R5 (G4)
R9
Lung
metastases
M2a
Hilum
R4 (G1)
Chest-wall
metastasis
M2b
8/1/13%
Primary
tumor
R6 (G1)
foun
were
way
migh
time
popu
W
indi
cell l
snap
such
their
beha
time
ory
prot
No. of Cells
IL12RB2
BCAS2
IFI16
FCAMR
PLB1
ALS2CR12
C2orf21
VHL
SGOL1
KLHL18
SSR3
CLCN2
WHSC1
ATXN1
DOPEY1
CCR6
INTS1
PTPRZ1
ZC3HC1
EXT1
RALGDS
MSRB2
EIF4G2
ANO5
C11orf68
MRPL51
KDM2B
X4
NUSAP1
TCF12
ZC3H18
DDX52
ZNF519
AKAP8
CYP4F3
KIAA0355
WDR62
KLK4
IGLON5
NLRP7
MAGEB16
SESN2
CCBL2
SETD2
PLRG1
CASP2
SSNA1
TH
PPFIA1
CDKN1B
WSCD2
ZNF780A
PPP6R2
MTOR
UGT2A1
ABHD11
GALNT11
RIMBP2
PSMD7
CENPN
SOX9
NPHS1
RBFOX2
KDM5C
KDM5C
SATL1
FLNA
ITGB3
LATS2
DIRAS3
NGEF
ZNF493
SPATA21
DDX58
DAPK1
ALKBH8
KL
ERCC5
DIO1
PIAS3
MR1
C3orf20
SETD2
TNIK
LIAS
FBXO1
AKAP9
ITIH5
WDR24
MYH8
TOM1
SBF1
KDM5C
USP51
NAP1L3
ADAMTSL4
DUSP12
SLC2A12
RAB27A
CIB2
RPS8
FAM129B
PHF21B
HDAC6
MAP3K6
MAMLD1
RLF
DNMT3A
HMG20A
ZNF521
MMAB
DACH2
SLC2A1
TM7SF4
ANKRD26
CD44
RT4
KIAA1267
C3
DAMTS10
IFNAR1
BCL11A
PLCL1
SETD2
KIAA1524
NRAP
HPS5
DIXDC1
LAMA3
CDH19
SUPT6H
WDR7
C2orf85
Protein expression is a stochastic process that leads to phenotypic
R7 (G4)
R8 (G4)
variation amongPerinephric
cells1–6. The cell–cell distribution of protein levels
metastasis
10 cm
M1
in microorganisms
has been well characterized7–23 but little is
known about such variability in human cells. Here, we studied
B Regional Distribution of Mutations
Ubiquitous
Shared primary
Shared metastasis
Private
the variability
of protein
levels in human cells, as well as the temporal dynamics of this variability,
and addressed whether cells
IntraLtumor%Heterogeneity%
M2b
with higher than average proteinM2a
levels
eventually have lower than
M1
R4
R9
R8
average levels, and if so, over what
timescale does this mixing
R5
R3
R2
occur. We measured fluctuations
over
time in the levels of 20
R1
PreM
endogenous
proteins
in
living
human
cells,
tagged by the gene
Tumor%Microenvironment%
PreP
GeneFc%Heterogeneity%
for
yellow
fluorescent
protein
at
their
chromosomal
loci24. We
C Phylogenetic Relationships of Tumor Regions
D Ploidy Profiling
FDG%
Ubiquitous
R2
R4
found variability with
a standard
deviation that ranged, for differR1 R2
Shared primary
R8 R3
R9
Shared metastasis
R5
Tetraploid to 30% of the mean. Mixing between
ent
proteins,
from
about
15%
KDM5C (missense and frameshift)
Private
PreP
mTOR (missense)
high and low levels occurred for all proteins, but the mixing time
R4b
SETD2 (frameshift)
longer than two
cell generations
(more than 40 h) for many
SETD2 (splice was
site)
M2b
R9
Normal tissue
?
proteins. We also taggedDI=1.43
pairs of proteins with two colours, and
R4a
Intr atumor Heterogeneity Revealed by multiregion Sequencing
A Biopsy Sites
R1 (G3)
R2 (G3)
R3 (G4)
VHL
R4 (G1)
R9
SETD2 (missense)
KDM5C (splice site)
Chest-wall
metastasis
M2b
Primary
tumor
R6 (G1)
R7 (G4)
DI=1.81
Lung
metastases
M2a
Hilum
R5 (G4)
R8 (G4)
Perinephric
metastasis
10 cm
M2b
PreM
M1
M2a
Perfusion%
M1
Hypoxia%
a
ProliferaFon%
Propidium Iodide Staining
Slow mixing
long memory
No mixing
B Regional Distribution of Mutations
Shared primary
Shared metastasis
Private
IL12RB2
BCAS2
IFI16
FCAMR
PLB1
ALS2CR12
C2orf21
VHL
SGOL1
KLHL18
SSR3
CLCN2
WHSC1
ATXN1
DOPEY1
CCR6
INTS1
PTPRZ1
ZC3HC1
EXT1
RALGDS
MSRB2
EIF4G2
ANO5
C11orf68
MRPL51
KDM2B
X4
NUSAP1
TCF12
ZC3H18
DDX52
ZNF519
AKAP8
CYP4F3
KIAA0355
WDR62
KLK4
IGLON5
NLRP7
MAGEB16
SESN2
CCBL2
SETD2
PLRG1
CASP2
SSNA1
TH
PPFIA1
CDKN1B
WSCD2
ZNF780A
PPP6R2
MTOR
UGT2A1
ABHD11
GALNT11
RIMBP2
PSMD7
CENPN
SOX9
NPHS1
RBFOX2
KDM5C
KDM5C
SATL1
FLNA
ITGB3
LATS2
DIRAS3
NGEF
ZNF493
SPATA21
DDX58
DAPK1
ALKBH8
KL
ERCC5
DIO1
PIAS3
MR1
C3orf20
SETD2
TNIK
LIAS
FBXO1
AKAP9
ITIH5
WDR24
MYH8
TOM1
SBF1
KDM5C
USP51
NAP1L3
ADAMTSL4
DUSP12
SLC2A12
RAB27A
CIB2
RPS8
FAM129B
PHF21B
HDAC6
MAP3K6
MAMLD1
RLF
DNMT3A
HMG20A
ZNF521
MMAB
DACH2
SLC2A1
TM7SF4
ANKRD26
CD44
RT4
KIAA1267
C3
DAMTS10
IFNAR1
BCL11A
PLCL1
SETD2
KIAA1524
NRAP
HPS5
DIXDC1
LAMA3
CDH19
SUPT6H
WDR7
C2orf85
IJROBP%62:545L553%(2009)%
tion through loss of SETD2 methyltransferase function driven by three distinct, regionally separated
mutations on a background of ubiquitous loss of
the other SETD2 allele on chromosome 3p.
Convergent evolution was observed for the
X-chromosome–encoded histone H3K4 demethylase KDM5C, harboring disruptive mutations in
R1 through R3, R5, and R8 through R9 (missense
C Phylogenetic Relationships of Tumor Regions
D Ploidy Profiling
Ubiquitous
R1 R2
Shared primary
R8 R3
R9
Shared metastasis
R5
KDM5C (missense and frameshift)
Private
PreP
mTOR (missense)
R2
R4
No. of Cells
Tetraploid
R4b
SETD2 (frameshift)
SETD2 (splice site)
Normal tissue
?
R4a
M2b
R9
DI=1.43
DI=1.81
VHL
SETD2 (missense)
KDM5C (splice site)
M2b
M2a
M1
R4
R9
R8
R5
R3
R2
R1
PreM
PreP
M2b
PreM
tion through loss of SETD2 methyltransferase function driven by three distinct, regionally separated
mutations on a background of ubiquitous loss of
the other SETD2 allele on chromosome 3p.
Convergent evolution was observed for the
X-chromosome–encoded histone H3K4 demethylase KDM5C, harboring disruptive mutations in
R1 through R3, R5, and R8 through R9 (missense
M1
M2a
Propidium Iodide Staining
and frameshift deletion) and a splice-site mutation
in the metastases (Fig. 2B and 2C).
mTOR
Functional Intratumor Heterogeneity
The mammalian target of rapamycin (mTOR) kinase carried a kinase-domain missense mutation
(L2431P) in all primary tumor regions except R4.
All tumor regions harboring mTOR (L2431P) had
and frameshift deletion) and a splice-site mutation
in the metastases (Fig. 2B and 2C).
mTOR
n engl j med 366;10
Functional Intratumor Heterogeneity
The mammalian target of rapamycin (mTOR) kinase carried a kinase-domain missense mutation
(L2431P) in all primary tumor regions except R4.
All tumor regions harboring mTOR (L2431P) had
Protein level
Ubiquitous
N$Engl$J$Med$366:883L892%(2012)%
nejm.org
march 8, 2012
PERSPECTIVES
Time
b
Time
887
The New England Journal of Medicine
887
Downloaded from nejm.org at STANFORD UNIVERSITY
on July 8, 2013. For personal use only. No other uses without permission.
Copyright © 2012 Massachusetts Medical Society. All rights reserved.
n engl j med 366;10
nejm.org
march 8, 2012
The New England Journal of Medicine
Downloaded from nejm.org at STANFORD UNIVERSITY on July 8, 2013. For personal use only. No other uses without permission.
Copyright © 2012 Massachusetts Medical Society. All rights reserved.
Role of non-genetic heterogeneity in tumour
evolution. Assume that in a tumour cell
population, non-genetic heterogeneity
spreads the expression level of a protein
among the cells so as to consistently produce 1% of cells with a high expression of
the encoding gene at a level that confers the
ability to survive exposure to a cytotoxic
drug, at a given dose (FIG. 2). In a small
non-necrotic early tumour that contains
~109 cells, as many as 107 cells would always
survive the treatment regardless of the presence of genetic variants. To be conservative,
if only 1% of these 107 cells — that is, 105
cells — were capable of expansion (the socalled cancer stem cells), and if these cells
maintained their transient advantageous
phenotype for just four cell divisions, there
would be 1,600,000 surviving cells in the
presence of the selective environment. This
‘pre-selection’ of non-genetic variants would
property of cell population dynamics that
may increase the effectiveness of Darwinian
selection by stretching the variability of a
trait by up to several orders of magnitude.
A role of non-genetic inheritance in evolution in general has been discussed, but it has
NonLGeneFc%Heterogeneity%
Stable
B
A B
A
A
B
B
A
B
Unstable
A B
Stable
A B
d
8
6
4
2
0
20
60
Time (h)
11 h
100
e
2
0.3
CV
A
Cell%cycle%
c
State space within the epigenetic landscape
Protein level (a.u.)
Network states
The network
Two-gene genome
0h
Protein level (norm.)
Gene%regulaFon%networks%
Box 2 | Basic concepts of
network dynamics
Potential
Mutation-less evolution of malignant traits
The varying cellular response to environmental factors by phenotypic outlier cells
suggests the following possibility: if slow
random fluctuations cause certain genes
to be expressed at abnormally high levels
over multiple cell generations in an outlier
cell, and if they encode proteins that, when
expressed at a higher level, confer a growth
advantage under some selective conditions,
then that cell could be selected for — as
though the advantageous trait were caused
by a gain-of-function mutation. Even if the
non-genetic ‘fitter’ state eventually wanes
after several cell divisions, this may temporarily expand a fitter subpopulation of cells
capable of surviving the selective environment, which itself may also be of limited
duration. Thus, enduring individuality that
is due to non-genetic heterogeneity satisfies
the conditions for Darwinian evolution for
a limited period of time.
non-genetic heterogeneity neither supports
nor refutes either side of the long-lasting
debate about whether genomic instability
that increases mutation rate is necessary 47,48
or not 49 for tumour progression. Instead, we
have illuminated a neglected but inevitable
Expression level
bacteria, known as persisters, may exhibit
an increased resistance to penicillin that can
be inherited, and hence they epitomize the
contribution of phenotypic variability to
overall population fitness40,42,45,46. Similarly,
phenotypic variability in the level of reduced
glutathione confers resistance to cadmium
in Saccharomyces cerevisiae populations44.
0.2
1
0.1
0
3
2
1
Time (cell generations)
Nature%444,%643L646%(2006)%%
A
B
Figure
1 | Protein
level dynamics in individual cells. a, Possible mixing
High
Low
dynamics of a protein in a population of cells. b, Cells expressing YFP CDA B
tagged topoisomerase 1 (TOP1) at different time-points. All cells are the
Networks dynamics
Nature Reviews | Genetics
Nat.$Rev.$Gen.%10,%336L342%(2009)%
A gene regulatory network orchestrates the expression of genes
across the genome,
generating
progeny
of the
cell shown in the first frame. Scale bar is 25 mm c, TOP1 levels
gene expression patterns, or profiles. Thus, each gene expression pattern reflects a state of the
as
a
function
of time
in a cell lineage. Sharp decreases in protein levels
network. Changes of the network states drive biological processes, such as cell differentiation,
by
controlling the necessary gene expression pattern. Such network dynamics are conveniently
indicate
cell-division
events
and lines originating after each division are the
represented by the state space of the network, in which each point at a given position of that space
Expression level
A
B
Unstable
represents a particular network state, hence, a gene expression pattern24. For this conceptual
illustration, the state space can be imagined as projected onto
1 a two-dimensional plane in which
each position represents a state. Neighbouring points in this plane represent similar gene
expression patterns. Changes in gene expression, and hence of the gene expression pattern, then
translate into the movement of the network state in the state space.
Because of the regulatory interactions, the genes cannot alter their expression independently.
Instead, gene expression changes are highly constrained such that a given expression pattern will
change as a whole, moving (or flowing) in a particular state space direction along a trajectory that is
dictated by the network interactions. If, for instance, gene A and gene B inhibit each other, then all
expression patterns in which A and B are equally expressed would be highly unstable. For example,
a slight excess of gene A (so that A>B) would suppress gene B, reducing its own inhibition and,
hence, promoting its own expression, which further increases the excess of A over B expression.
This would continue until the network reaches an equilibrium state at A>>B when the expression of
A cannot increase further owing to other limitations. In general, because of the interactions, most
network states are unstable. They move in state space seeking to satisfy the regulatory interactions
or, equivalently, until they find stable equilibrium states. Such stable steady states are also called
attractor states. They correspond to the gene expression patterns that define the biological cell
types26,27,71,72 (see the figure).
0
T
TOP
cell-c
by th
acros
meas
(CV
Department of Molecular Cell Biology, Weizmann Institute of Science, Rehovot, 76100 Israel. {P
Massachusetts 02115, USA.
*These authors contributed equally to this work.
The epigenetic landscape
For better intuitive conceptualization, each network state in the state space plane can be assigned
an ‘elevation’ or a quasi-potential energy (that is, the potential), the height of which is inversely
©2006 Nature Publishing G
3%
8/1/13%
How%do%QuanFtaFve%PET%Measurements%Relate%
to%Individual%Cell%Parameters?%
Cancer%cells%
+%Stromal%cells%
+%Immune%cells%
%%%%%%%%%%%%%%%%%%%%%%%%%%%%%
1%SUV%number%
Radionuclide%Imaging:%The%UlFmate%
Heterogeneity%is%at%the%SingleLCell%Level%
One%voxel%
=%108%–%109%cells%
CPS!
One%pixel%
=%102%–%103%cells%
SingleLcell%imaging%
5%μm%
SUV!
Autoradiography%
100%μm%
4%mm%
PET%scan%
Goal%
J.$Nucl.$Med.$Technol.$33(2),%2005,%pp.%69L74%
Nucl.$Med.$Biol.$31(7),%2004,%pp.%875L882%
4%
8/1/13%
SpaFal%ResoluFon%for%Radionuclide%Imaging%
Digital%autoradiography%
ron
%ra
ng
e%
Positron%emission%tomography%
po
si t
51
1%k
ev
%
18F%
sample%
18F%
e+%
e+%
sample%
thickness%
stopping%
power%
water%
phosphor%plate%
For%high%spaFal%resoluFon:%
L Thin%sample%
L High%stopping%power%
C.S.$Levin,$et$al.$1999$
A%“radioluminescence%microscope”%
ScinFllator:%CdWO4%
%
Imaging%system%
Density:%7.9%g/cm3%
EffecFve%Z:%64%
Light%yield:%15,000%
photons%/%MeV%
Hygroscopic:%No%
AVerglow:%No%
%
EMLCCD%camera%
1024x1024%pixels%
Cooled%@%L70°C%
40X,%1.3%NA%objecFve%
Live%cell%imaging%
5%
8/1/13%
A%digital%image%acquisiFon%scheme%
Track%analysis:%
annihilaFon%
photon%
short%positron%
track%
Imaging%scheme:%
long%positron%
track%
G.$Pratx$et$al.$JNM$(in$press)$
FDG%uptake%in%single%cells%
FDG%(420%μCi/ml)%
2.%Fast%(1%h)%&%
incubate%(1%h)%%
1.%Seed%104%4T1%
cells%
3.%Wash%out%&%
image%(5%min)%
5%min%
Brighrield%
FDG%(reconstrucFon)%
6%
8/1/13%
FDG%uptake%in%single%cells%
FDG%(420%μCi/ml)%
3.%Wash%out%&%
image%(5%min)%
2.%Fast%(1%h)%&%
incubate%(1%h)%%
1.%Seed%104%4T1%
cells%
5%min%
Overlay%
FDG%uptake%in%single%cells%
FDG%(420%μCi/ml)%
3.%Wash%out%&%
image%(5%min)%
2.%Fast%(1%h)%&%
incubate%(1%h)%%
1.%Seed%104%4T1%
cells%
5%min%
“SUV”%=%%
150
COV%=%46%%
cell%
weight%
acFvity%in%
the%media%
100
SUV
Cell%
acFvity%%
volume%of%
media%
50
0
0
Cell%weight%≈%3%ng%%(HeLa)%
10
20
Cell #
30
40
hLp://bionumbers.hms.harvard.edu$
7%
8/1/13%
Timelapse%imaging%of%FDG%uptake:%Protocol%
Seed%104%MDAL
MBL231%cells%
(24%h)%&%fast%(1%h)%
Timelapse:%
10%images%/%h%
+%FDG%(5%μCi)%
Influx!
5%min%
+%FDG%(400%μCi)%
wash%out%
Efflux!
5%min%
T%=%L1%h%
T%=%0%h%
T%=%8%h%
Uptake%of%FDG%in%live%cells%
Note: Video available on PLOS One
8%
8/1/13%
Tracer%kineFc%modeling:%Influx%
brighrield%
radioluminescence%(Fmelapse,%10%images%/%h)%
+%5%μCi%FDG%
1
RL signal (A.U.)
0
0
1
Cell avg.
Cont. avg.
RL signal (A.U.)
Cell
Control
2
4
Time (hr)
6
8
0
0
single%
cell%
Data
Model
Patlak
2
4
Time (hr)
6
8
G.$Pratx$et$al.$PLOS$One$2012$
Efflux%of%FDG%from%live%cells%
Note: Video available on PLOS One
9%
8/1/13%
Tracer%kineFc%modeling:%Efflux%
radioluminescence%(Fmelapse,%10%images%/%h)%
0.5h
t = 0h
1
RL signal (A.U.)
Cell
Control
0
0
8h
2h
Cell avg.
Cont. avg.
1
RL signal (A.U.)
brighrield%
single%
cell%
Data
Model
Fast comp.
Slow comp.
0
2
4
Time (hr)
6
8
0
2
4
Time (hr)
6
8
G.$Pratx$et$al.$PLOS$One$2012$
Piralls%of%Bulk%Cell%Measurements%
Bulk%
Σ%
Compartmental%
Analysis%
k1%
k2%
…%
?%
Single%
cell%
Compartmental%
Analysis%
k1,%k2,%…%
k1,%k2,%…%
k1,%k2,%…%
Σ%
k1%
k2%
…%
10%
8/1/13%
Bulk%ProperFes%≠%Average%ProperFes%
RL signal (A.U.)
1
1
RL signal (A.U.)
1
RL signal (A.U.)
0
0
2
0
0
single%
cells%
4
Time (hr)
2
6
4
Time (hr)
0
0
2
K1%
bulk%
RL signal (A.U.)
1
8
6
4
Time (hr)
0
0
8
6
2
4
Time (hr)
6
8
8
K2%
K3%
Tissue%SecFon%Imaging:%Zr89LRituximab%in%the%Spleen%
11%
8/1/13%
Tissue%SecFon%Imaging:%Zr89LRituximab%in%the%Spleen%
Conclusions%
Radioluminescence% microscopy% is% a% new% imaging% technique%
that%can%sensiFvely%and%quanFtaFvely%characterize%the%uptake%
of% small% molecules% in% heterogeneous% populaFons% of% single%
cells.%
%
We% are% applying% it% to% relate% macroscopic% parameters%
measured% by% PET% to% cellular% parameters% that% are% specific% to%
cellular%funcFon,%disease%state,%and%response%to%therapy.%
12%
8/1/13%
Acknowledgements%
Conroy%Sun%
Laura%Sasportas%
Marian%Axente%
Marta%Colomer%
Colin%Carpenter%
%
BCRP W81XWH-11-1-0087
Kai%Chen%
Lynn%MarFn%
John%Sunwoo%
Ted%Graves%
Lei%Xing%
NIH 5P50CA114747 ICMIC
Equipment loan
13%
