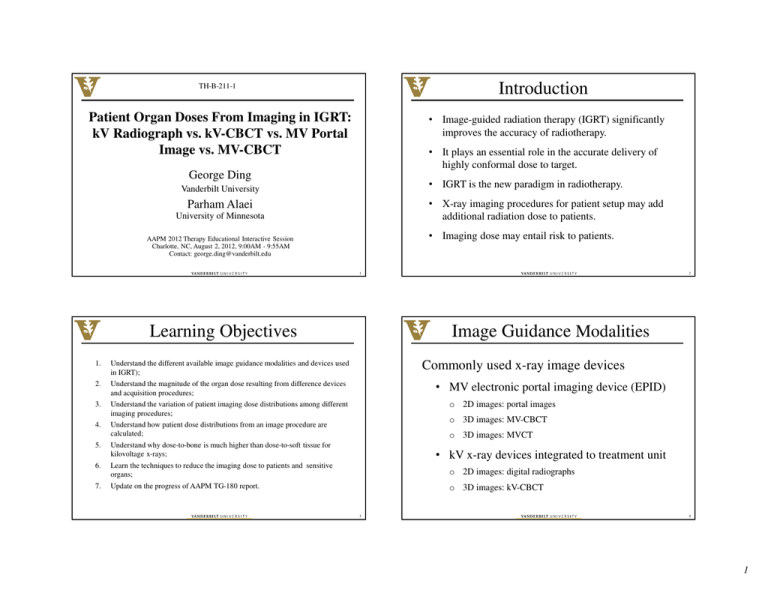
Introduction Patient Organ Doses From Imaging in IGRT: Image vs. MV-CBCT
advertisement

Introduction TH-B-211-1 Patient Organ Doses From Imaging in IGRT: kV Radiograph vs. kV-CBCT vs. MV Portal Image vs. MV-CBCT • Image-guided radiation therapy (IGRT) significantly improves the accuracy of radiotherapy. • It plays an essential role in the accurate delivery of highly conformal dose to target. George Ding • IGRT is the new paradigm in radiotherapy. Vanderbilt University • X-ray imaging procedures for patient setup may add additional radiation dose to patients. Parham Alaei University of Minnesota • Imaging dose may entail risk to patients. AAPM 2012 Therapy Educational Interactive Session Charlotte, NC, August 2, 2012, 9:00AM - 9:55AM Contact: george.ding@vanderbilt.edu 1 Learning Objectives 1. 2. 3. 4. 5. 6. 7. 2 Image Guidance Modalities Commonly used x-ray image devices Understand the different available image guidance modalities and devices used in IGRT); Understand the magnitude of the organ dose resulting from difference devices and acquisition procedures; • MV electronic portal imaging device (EPID) o 2D images: portal images Understand the variation of patient imaging dose distributions among different imaging procedures; Understand how patient dose distributions from an image procedure are calculated; o 3D images: MV-CBCT o 3D images: MVCT Understand why dose-to-bone is much higher than dose-to-soft tissue for kilovoltage x-rays; Learn the techniques to reduce the imaging dose to patients and sensitive organs; • kV x-ray devices integrated to treatment unit o 2D images: digital radiographs Update on the progress of AAPM TG-180 report. o 3D images: kV-CBCT 3 4 1 Imaging dose from MV portal images Electronic portal imaging device (EPID) An Anterior and a Right lateral field (2 MUs for each field) 100 EPID 90 Brain % volume 80 70 Brain Stem 60 Left eye 50 40 30 Right eye 20 10 0 0 1 2 3 4 5 6 dose /cGy 6 5 Imaging dose from MV-CBCT Imaging dose from MVCT in Tomo Dose at the center of s to a 30 cm water phantom: Fine pitch: 2.5 cGy (4mm couch travel/rotation) Normal pitch: 1.25 cGy (8mm couch travel/rotation) Coarse pitch: 0.83 cGy (12mm couch travel/rotation) Statistics: 73% of Tomo customer imaging procedures are done using the Coarse pitch. 24% are done using the Normal pitch. An MVCT image acquired during commissioning Courtesy Edward Chao, Accuray Incorporated and T. Rock Mackie, UW, Madison, WI 7 8 2 Dose dependency on depth for kV and MV kV x-ray devices on treatment unit 9 Dose dependency on medium for kV and MV 10 Patient dose from an anterior field for kV and MV 6 MV beam (2 MUs) Single beam incident from right 180 A 100 kVp 6 MV 160 140 220 6 MV 100 90 180 Bone slabs in water 160 60 50 40 30 Bone slabs in water 40 Monte Carlo Density corrected 120 100 B 100 kVp (8.0 mAs) 80 A 6 8 10 12 14 depth in phantom /cm 16 18 0 5 10 15 depth (Line A-B) / cm MV: 100% dose = 2.17 cGy kV: 100% dose = 0.094 cGy 0 4 dose to soft tissue 0 20 0 2 20 40 10 0 80 140 60 20 100 60 Relative dose Relative dose 70 125 kVp 200 Monte Carlo Density corrected 80 dose to bone 120 % dose 110 20 0 2 4 6 8 10 12 14 16 18 20 B depth in phantom /cm B MV: exit dose 40% kV: exit dose 4% 11 3 Dosimetry of imaging dose for kV and MV kV x-ray medium dependency: soft tissues vs. bone • MV beam dose: Model based algorithms or Monte Carlo (beams from linear accelerators commissioned in TPS) Reference beam output calibration (dosimetry protocols) • kV beams dose: Monte Carlo methods (beams from X-ray tubes simulated) X-ray source output calibration for each specific procedure (Med Phys v35, pp.1135-44, 2008 and Phys Med Biol, v55, 5231-5248, 2010) • Validation of calculated dose: Experimental verifications: calculation predicted dose vs. measured dose Data from: J. H. Hubbell and S. M. Seltzer, "Tables of X-Ray Mass Attenuation Coefficients and Mass EnergyAbsorption Coefficients," National Institute of Standards and Technology, Gaithersburg, MD NISTIR 5632, 1995. 14 3D images: kV CBCT Organ dose dependency on scan techniques: Head 15 16 4 Imaging dose reduction OBI 1.3 vs 1.4: Thorax scan Radiation dose dependency on scanned length: Pelvis 17 Dose dependency on scan techniques and filters: Pelvis Spot Light 18 Dose dependency on scan techniques and filters: Pelvis Spot Light 19 20 5 MV(EPID), kV-CBCT(OBI 1.4), kV-CBCT(TrueBeam), kV radiographs Radiation dose dependency on patient size and scan techniques 21 MV(EPID), kV-CBCT(OBI 1.4), kV-CBCT(TrueBeam), kV radiographs 22 Progress in technology continues to reduce imaging dose Example: a new kV x-ray source in TrueBeam results reduced dose mainly due to: • • 23 An additional kV beam hardening filter Less lower energy photons in the energy spectrum 24 6 Summary • Imaged area is larger than the treatment area • Repeated imaging procedures may sum up additional doses to radiosensitive organs • Current x-ray imaging procedures in IGRT: Summary MV imaging: – dose to bones is ~ dose to soft tissues – exit dose (~ 50% of entrance dose) 2D imaging (two orthogonal or oblique fields) − − − kV imaging: MV (setup fields using EPID) kV (digital radiographs) – Dose-to-bone is 2-4 times ~ dose-to-soft tissues – exit dose (~ 5% of entrance dose) 3D volumetric imaging − − MVCT / MV-CBCT − kV-CBCT 25 26 Summary Summary Doses from image-guided procedures Imaging dose comparison from different imaging procedures in descending order: MV imaging: – – – EPID: 4 - 6 cGy from two orthogonal portal images MVCT (TOMO): 1 - 3 cGy MV-CBCT: 1 - 16 cGy kV imaging: kV DR: – kV-CBCT – • • Soft tissue: Bone: 0.1 - 1.0 cGy – MV-CBCT (3D imaging) – MV (EPID) (2D imaging) – kV-CBCT (3D imaging) – kV radiograph (2D imaging) 0.1 - 3 cGy /acquisition 0.3 - 6 cGy /acquisition 27 28 7 Future AAPM TG-180 TG-180 Specific list of charges Improve imaging technology (on-going progress by manufacturers) – reduce imaging doses and improve image quality. 1. To identify the important issues such as the large variations between dose to bone (or bone Use x-ray imaging efficiently: 2. To provide an overview on the general approach to clinical implementation of accounting marrow) and dose to soft tissues for x-rays at kilovoltage energy range. for the imaging guidance dose from x-ray imaging procedures in radiotherapy include megavoltage electronic portal imaging (MV EPID), kilovoltage digital radiography (kV DR), tomotherapy MVCT, megavoltage cone-beam CT (MV-CBCT) and kilovoltage conebeam CT (kV-CBCT). – Choose the procedure and the frequency that is most suitable for the purpose – Develop protocols for using imaging procedures – Pay attention to pediatric patients and reduce imaged region of interest if possible 3. To provide general guidelines for • commissioning an imaging beam in a treatment planning system • various verification techniques and experimental methods to assure an accurate Account and document imaging dose for radiotherapy patients – Calculate organ doses resulting from image guided procedures / estimate organ doses by using tabulated values resulting from typical imaging procedures imaging beam model commission process • specific recommendations on the dose calculation accuracy from an imaging procedure in a treatment planning system. – Account imaging dose as part of total dose to patients in radiotherapy treatment planning systems TG-0180 draft report v.2 is being distributed and discussed in the group . 29 30 8


