Incorporating life sciences applications in the architectural optimizations of next-generation petaflop-system
advertisement

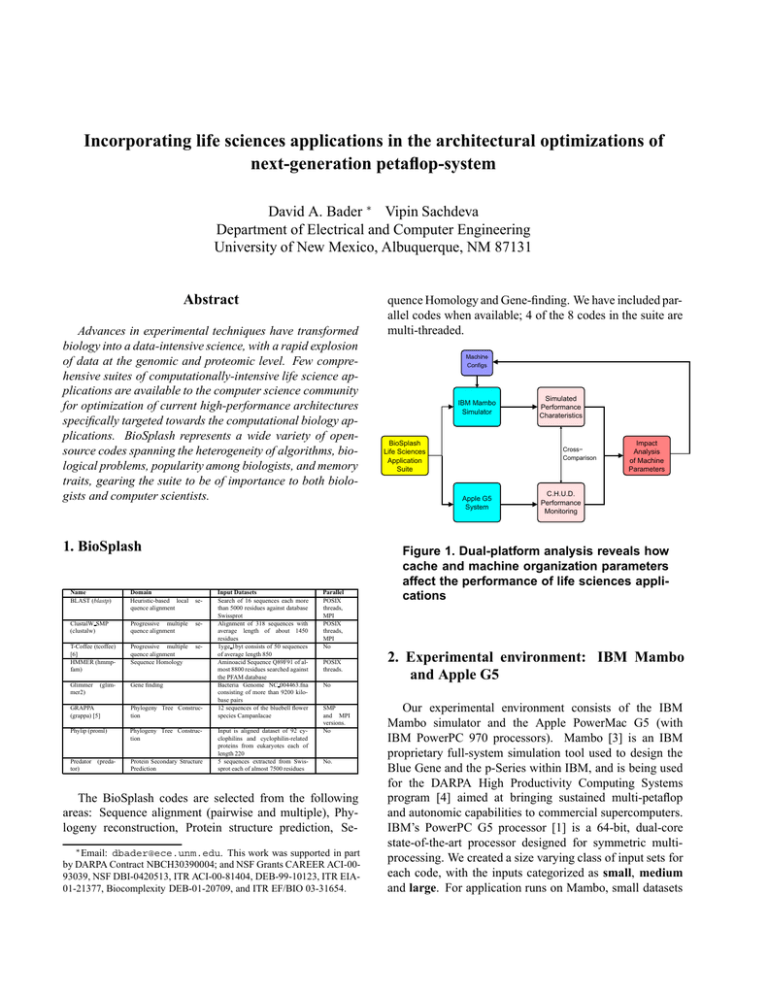
Incorporating life sciences applications in the architectural optimizations of next-generation petaflop-system David A. Bader ∗ Vipin Sachdeva Department of Electrical and Computer Engineering University of New Mexico, Albuquerque, NM 87131 Abstract Advances in experimental techniques have transformed biology into a data-intensive science, with a rapid explosion of data at the genomic and proteomic level. Few comprehensive suites of computationally-intensive life science applications are available to the computer science community for optimization of current high-performance architectures specifically targeted towards the computational biology applications. BioSplash represents a wide variety of opensource codes spanning the heterogeneity of algorithms, biological problems, popularity among biologists, and memory traits, gearing the suite to be of importance to both biologists and computer scientists. 1. BioSplash Name BLAST (blastp) Domain Heuristic-based local quence alignment ClustalW SMP (clustalw) Progressive multiple quence alignment se- T-Coffee (tcoffee) [6] HMMER (hmmpfam) Progressive multiple quence alignment Sequence Homology se- Glimmer mer2) Gene finding (glim- se- GRAPPA (grappa) [5] Phylogeny Tree Construction Phylip (proml) Phylogeny Tree Construction Predator (predator) Protein Secondary Structure Prediction Input Datasets Search of 16 sequences each more than 5000 residues against database Swissprot Alignment of 318 sequences with average length of about 1450 residues 1yge 1byt consists of 50 sequences of average length 850 Aminoacid Sequence Q89F91 of almost 8800 residues searched against the PFAM database Bacteria Genome NC 004463.fna consisting of more than 9200 kilobase pairs 12 sequences of the bluebell flower species Campanlacae Input is aligned dataset of 92 cyclophilins and cyclophilin-related proteins from eukaryotes each of length 220 5 sequences extracted from Swissprot each of almost 7500 residues Parallel POSIX threads, MPI POSIX threads, MPI No POSIX threads. Machine Configs IBM Mambo Simulator BioSplash Life Sciences Application Suite Simulated Performance Charateristics Cross− Comparison Apple G5 System Impact Analysis of Machine Parameters C.H.U.D. Performance Monitoring Figure 1. Dual-platform analysis reveals how cache and machine organization parameters affect the performance of life sciences applications 2. Experimental environment: IBM Mambo and Apple G5 No SMP and MPI versions. No No. The BioSplash codes are selected from the following areas: Sequence alignment (pairwise and multiple), Phylogeny reconstruction, Protein structure prediction, Se∗ Email: quence Homology and Gene-finding. We have included parallel codes when available; 4 of the 8 codes in the suite are multi-threaded. dbader@ece.unm.edu. This work was supported in part by DARPA Contract NBCH30390004; and NSF Grants CAREER ACI-0093039, NSF DBI-0420513, ITR ACI-00-81404, DEB-99-10123, ITR EIA01-21377, Biocomplexity DEB-01-20709, and ITR EF/BIO 03-31654. Our experimental environment consists of the IBM Mambo simulator and the Apple PowerMac G5 (with IBM PowerPC 970 processors). Mambo [3] is an IBM proprietary full-system simulation tool used to design the Blue Gene and the p-Series within IBM, and is being used for the DARPA High Productivity Computing Systems program [4] aimed at bringing sustained multi-petaflop and autonomic capabilities to commercial supercomputers. IBM’s PowerPC G5 processor [1] is a 64-bit, dual-core state-of-the-art processor designed for symmetric multiprocessing. We created a size varying class of input sets for each code, with the inputs categorized as small, medium and large. For application runs on Mambo, small datasets are used due to the overhead of simulating, while for Apple G5, relatively long-running instances of the datasets are described and are for instance among the longest in Genbank and Swissprot, database searches were performed against complete databases such as the Genbank, Swissprot, and PFAM, databases. 3. Performance Analysis An advantage of the Mambo and MONster tools is the “live graph”capabilities that report accumulated data not only at the end of each run, but also at chosen regular sampling intervals.. Using such graphs, we correlate the performance data in phases of the application, and suggest optimizations targeted at separate regions of the application. Through our dual platform analysis, we do a cross comparison and suggest system design parameters for machine configurations that may improve the performance of these codes on next-generation computing systems. In this abstract, we briefly show the impact of our research with an example of ClustalW, a popular multiple sequence alignment program. Additional results are available in [2]. In the clustalw livegraphs, we find an interesting observation: the instructions per cycle increases in the last phase of the application, even though L1 data miss rate (right plot) increases in the same phase; this increase is due to the fall in branch misprediction rate, implying that the performance of the last phase of clustalw is more closely related to branch mispredicts than L1 data miss rate. A significant part of our research correlates the per- Figure 2. Clustalw Performance Graphs. formance metrics at the machine level with the phase of the higher-level algorithm. Clustalw livegraph plotted for the first and the third phase shows an order of magnitude higher rate of arithmetic instructions compared to the second phase, denoting the larger time complexity of the algorithm in phase one and three. L1 data cache misses are higher in the second phase, due to unpredictable access pattern; the sequences with the lowest distance are joined together in the guide tree, with the other sequences recomputing distance to the joined sequence. The heuristic is repeated, until all the sequences are joined together into a Figure 3. ClustalW region I (top), II (bottom left) and III (bottom right) showing differences in algorithmic complexity and memory access pattern. guide tree formation. We have recorded a wide variety of instruction and memory level hardware counters for each code using CHUD tool on Apple PowerPc G5, and MAMBO; fully detailed analysis and all graphs for MAMBO and Apple PowerPC G5 are included in [2]. References [1] Apple Computer, Inc. PowerPC G5: White Paper, June 2004. images.apple.com/powermac/pdf/ PowerPCG5 WP 06092004.pdf. [2] D. Bader, V. Sachdeva, V. Agarwal, G. Goel, and A. Singh. BioSPLASH: A sample workload for bioinformatics and computational biology for optimizing next-generation highperformance computer systems. Technical report, University of New Mexico, Albuquerque, NM, Apr. 2005. [3] P. Bohrer, M. Elnozahy, A. Gheith, C. Lefurgy, T. Nakra, J. Peterson, R. Rajamony, R. Rockhold, H. Shafi, R. Simpson, E. Speight, K. Sudeep, E. Van Hensbergen, and L. Zhang. Mambo – a full system simulator for the PowerPC architecture. ACM SIGMETRICS Performance Evaluation Review, 31(4):8–12, 2004. [4] Defense Advanced Research Projects Agency (DARPA). High productivity computing systems program. http:// www.darpa.mil/ipto/programs/hpcs/. [5] B. M. Moret, D. Bader, T. Warnow, S. Wyman, and M. Yan. GRAPPA: a high-performance computational tool for phylogeny reconstruction from gene-order data. In Proc. Botany, Albuquerque, NM, Aug. 2001. [6] C. Notredame, D. Higgins, and J. Heringa. T-Coffee: A novel method for multiple sequence alignments. J. Molecular Biology, 302:205–217, 2000.


