Document 14147132
advertisement
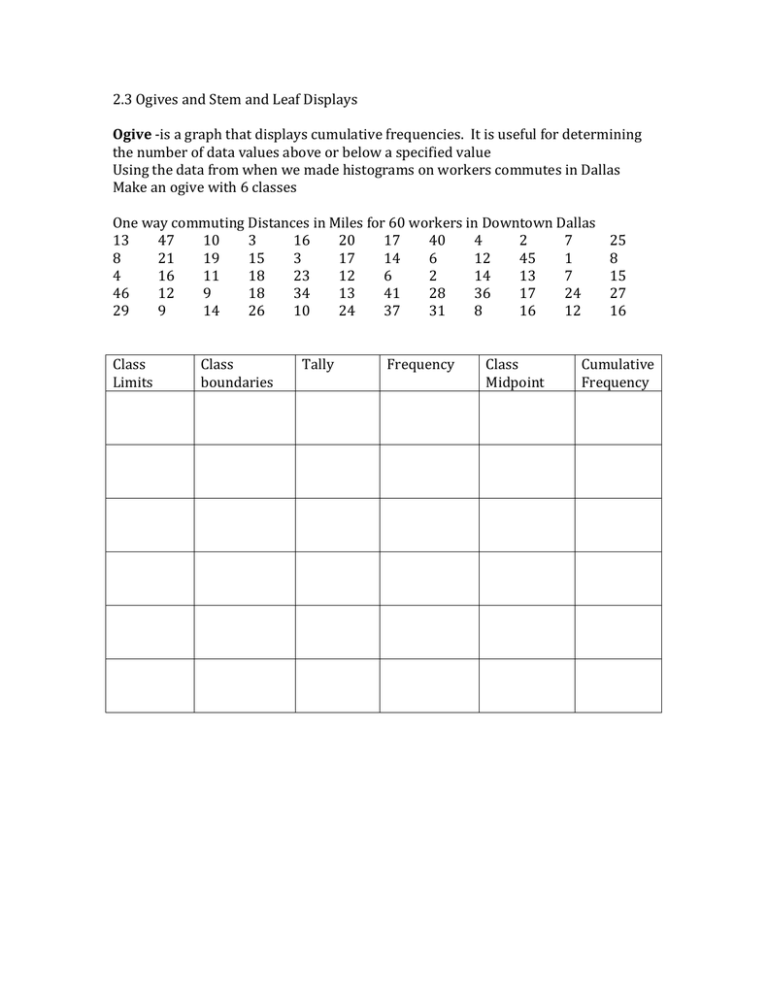
2.3 Ogives and Stem and Leaf Displays Ogive -­‐is a graph that displays cumulative frequencies. It is useful for determining the number of data values above or below a specified value Using the data from when we made histograms on workers commutes in Dallas Make an ogive with 6 classes One way commuting Distances in Miles for 60 workers in Downtown Dallas 13 47 10 3 16 20 17 40 4 2 7 25 8 21 19 15 3 17 14 6 12 45 1 8 4 16 11 18 23 12 6 2 14 13 7 15 46 12 9 18 34 13 41 28 36 17 24 27 29 9 14 26 10 24 37 31 8 16 12 16 Class Class Tally Frequency Class Cumulative Limits boundaries Midpoint Frequency To make an ogive 1. Make a frequency table showing class boundaries and cumulative frequencies 2. For each class make a dot over the upper class boundary at the height of the cumulative frequency. (upper class boundary, cumulative class frequency) 3. Always start on the x axis at the lower class boundary of the first class Stem and Leaf Display 1. Divide the digits of each data value into two parts. The leftmost part is called the stem, the rightmost part is the leaf. 2. Align all the stems in a vertical column from smallest to largest. Draw a vertical line to the right of all the stems 3. Place all the leaves in their appropriate row with their stem, then arrange all the leaves in increasing order. 4. Always label what each stem|leaf combo represents as an actual number. Using the data on scores of conference championship games make a stem and leaf display Winning scores of basketball conference championships 88 94 105 110 94 96 103 112 126 99 81 97 121 108 117 105 98 136 88 91 112 104
