Descriptive Statistics
advertisement

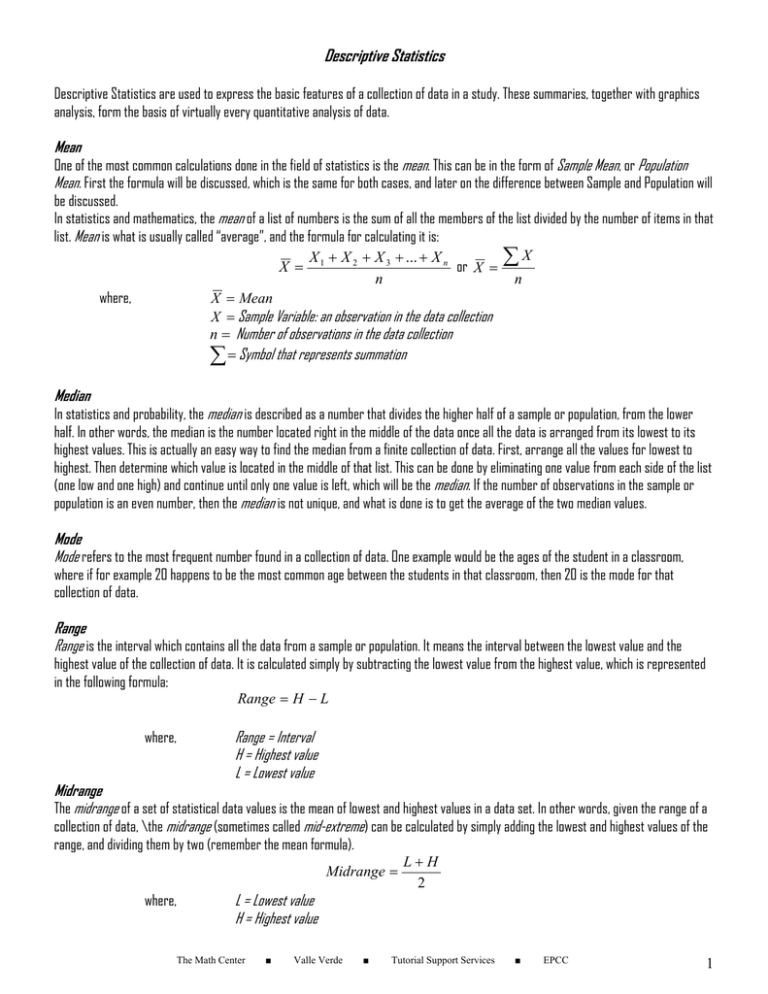
Descriptive Statistics Descriptive Statistics are used to express the basic features of a collection of data in a study. These summaries, together with graphics analysis, form the basis of virtually every quantitative analysis of data. Mean One of the most common calculations done in the field of statistics is the mean. This can be in the form of Sample Mean, or Population Mean. First the formula will be discussed, which is the same for both cases, and later on the difference between Sample and Population will be discussed. In statistics and mathematics, the mean of a list of numbers is the sum of all the members of the list divided by the number of items in that list. Mean is what is usually called “average”, and the formula for calculating it is: X + X 2 + X 3 + ... + X n ∑X X = 1 or X = n n where, X = Mean X = Sample Variable: an observation in the data collection n = Number of observations in the data collection ∑ = Symbol that represents summation Median In statistics and probability, the median is described as a number that divides the higher half of a sample or population, from the lower half. In other words, the median is the number located right in the middle of the data once all the data is arranged from its lowest to its highest values. This is actually an easy way to find the median from a finite collection of data. First, arrange all the values for lowest to highest. Then determine which value is located in the middle of that list. This can be done by eliminating one value from each side of the list (one low and one high) and continue until only one value is left, which will be the median. If the number of observations in the sample or population is an even number, then the median is not unique, and what is done is to get the average of the two median values. Mode Mode refers to the most frequent number found in a collection of data. One example would be the ages of the student in a classroom, where if for example 20 happens to be the most common age between the students in that classroom, then 20 is the mode for that collection of data. Range Range is the interval which contains all the data from a sample or population. It means the interval between the lowest value and the highest value of the collection of data. It is calculated simply by subtracting the lowest value from the highest value, which is represented in the following formula: Range = H − L where, Range = Interval H = Highest value L = Lowest value Midrange The midrange of a set of statistical data values is the mean of lowest and highest values in a data set. In other words, given the range of a collection of data, \the midrange (sometimes called mid-extreme) can be calculated by simply adding the lowest and highest values of the range, and dividing them by two (remember the mean formula). Midrange = where, L = Lowest value H = Highest value The Math Center ■ Valle Verde ■ L+H 2 Tutorial Support Services ■ EPCC 1 Absolute Deviation In Statistics, an absolute deviation of an element from a collection of data is the absolute difference between that observation and a given point. That given point from which the deviation is measured, is usually either the mean or the median of the collection of data. Calculating the absolute deviation would be very useful for other important computations like variance and standard deviation. D = X − X or D = X − Median where, D = Absolute deviation X = An element from the collection of data X = Mean Variance In Statistics, variance is a measure of its statistical dispersion with respect to the mean. While the absolute deviation gives the difference of an observation with respect to the mean, variance gives a more complete study of the variability of the values with respect to the mean too, but considering all the observation from the collection of data. The formula for calculating the variance is as follows: (X − X )2 ∑ 2 S = n 2 where, S = Variance X = Observation from the collection of data X = Mean n = Number of observations in the collection of data Standard Deviation Another common statistics calculation is the standard deviation, which along with the mean and variance, are the base for more advanced calculations and analysis in Statistics. Standard Deviation is a measure of how widely spread the values in a data set are. Remember that the variance is given in units squared. Standard Deviation, being the square root of that quantity, measures the spread of the data about the mean, measured in the same units as the data. The formula is as follows: ∑ (X − X ) 2 S= S = 2 where, n S = Standard Deviation S 2 = Variance X = Observation from the collection of data X = Mean n = Number of observations in the collection of data Difference between Sample and Population Earlier in this handout it was mentioned that the mean formula for both sample mean and population mean is basically the same. In fact, in order to calculate the mean for both cases the same procedure is followed, adding all the observation and dividing it by the number of observations. The difference between these two cases is what is actually being calculated. • A population is the complete collection of all elements to be studied. These elements can be scores, people, measurements, etc. • A sample is a sub-collection of elements drawn from a population. A sample is basically a sub-group from the population. The difference between computing the sample or population mean is either the calculations are being done for the whole data set, or a sub-group of that data set. In either case, the formula remains the same. This case also applies for population variance and population standard deviation. The Math Center ■ Valle Verde ■ Tutorial Support Services ■ EPCC 2


