20132014 Actual Financial data Totals for Plano ISD (043910)
advertisement

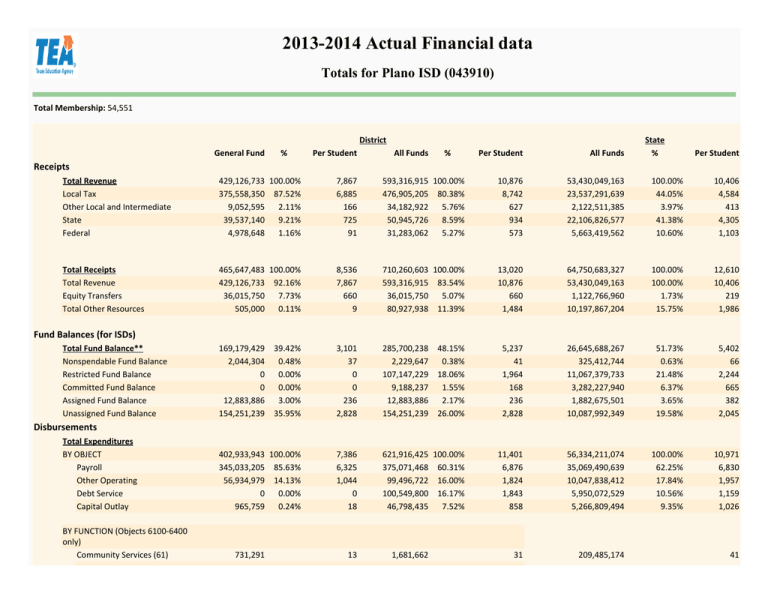
2013­2014 Actual Financial data Totals for Plano ISD (043910) Total Membership: 54,551 District General Fund % Per Student All Funds % Per Student All Funds State % Per Student Receipts Total Revenue Local Tax Other Local and Intermediate State Federal 429,126,733 100.00% 375,558,350 87.52% 9,052,595 2.11% 39,537,140 9.21% 4,978,648 1.16% 7,867 6,885 166 725 91 593,316,915 100.00% 476,905,205 80.38% 34,182,922 5.76% 50,945,726 8.59% 31,283,062 5.27% 10,876 8,742 627 934 573 53,430,049,163 23,537,291,639 2,122,511,385 22,106,826,577 5,663,419,562 100.00% 44.05% 3.97% 41.38% 10.60% 10,406 4,584 413 4,305 1,103 Total Receipts Total Revenue Equity Transfers Total Other Resources 465,647,483 100.00% 429,126,733 92.16% 36,015,750 7.73% 505,000 0.11% 8,536 7,867 660 9 710,260,603 100.00% 593,316,915 83.54% 36,015,750 5.07% 80,927,938 11.39% 13,020 10,876 660 1,484 64,750,683,327 53,430,049,163 1,122,766,960 10,197,867,204 100.00% 100.00% 1.73% 15.75% 12,610 10,406 219 1,986 169,179,429 2,044,304 0 0 12,883,886 154,251,239 39.42% 0.48% 0.00% 0.00% 3.00% 35.95% 3,101 37 0 0 236 2,828 285,700,238 2,229,647 107,147,229 9,188,237 12,883,886 154,251,239 48.15% 0.38% 18.06% 1.55% 2.17% 26.00% 5,237 41 1,964 168 236 2,828 26,645,688,267 325,412,744 11,067,379,733 3,282,227,940 1,882,675,501 10,087,992,349 51.73% 0.63% 21.48% 6.37% 3.65% 19.58% 5,402 66 2,244 665 382 2,045 402,933,943 100.00% 345,033,205 85.63% 56,934,979 14.13% 0 0.00% 965,759 0.24% 7,386 6,325 1,044 0 18 621,916,425 100.00% 375,071,468 60.31% 99,496,722 16.00% 100,549,800 16.17% 46,798,435 7.52% 11,401 6,876 1,824 1,843 858 56,334,211,074 35,069,490,639 10,047,838,412 5,950,072,529 5,266,809,494 100.00% 62.25% 17.84% 10.56% 9.35% 10,971 6,830 1,957 1,159 1,026 31 209,485,174 Fund Balances (for ISDs) Total Fund Balance** Nonspendable Fund Balance Restricted Fund Balance Committed Fund Balance Assigned Fund Balance Unassigned Fund Balance Disbursements Total Expenditures BY OBJECT Payroll Other Operating Debt Service Capital Outlay BY FUNCTION (Objects 6100‐6400 only) Community Services (61) 731,291 13 1,681,662 41 Total Operating Expenditures Instruction (11,95) Instructional Res Media (12) Curriculum/Staff Develop (13) Instructional Leadership (21) School Leadership (23) Guidance Counseling Svcs (31) Social Work Services (32) Health Services (33) Transportation (34) Food (35) Extracurricular (36) General Administration (41,92) Plant Maint/Operation (51) Security/Monitoring (52) Data Processing Services (53) Total Disbursements Total Expenditures Equity Transfers Total Other Uses Intergovernmental Charge 401,236,893 100.00% 265,134,002 66.08% 7,485,634 1.87% 5,775,848 1.44% 2,781,749 0.69% 23,253,235 5.80% 7,355 4,860 137 106 51 426 461,111,198 100.00% 291,154,978 63.14% 7,590,128 1.65% 7,250,545 1.57% 3,369,520 0.73% 23,831,309 5.17% 8,453 5,337 139 133 62 437 44,633,165,100 25,448,473,140 571,005,868 922,169,731 663,314,208 2,581,353,060 100.00% 57.02% 1.28% 2.07% 1.49% 5.78% 8,692 4,956 111 180 129 503 17,064,600 4.25% 313 18,216,553 3.95% 334 1,562,958,047 3.50% 304 913,246 4,960,471 12,457,569 0 6,468,704 0.23% 1.24% 3.10% 0.00% 1.61% 17 91 228 0 119 914,345 5,201,709 12,525,125 22,481,937 11,727,299 0.20% 1.13% 2.72% 4.88% 2.54% 17 95 230 412 215 122,313,864 444,949,486 1,308,273,663 2,577,586,605 1,265,051,350 0.27% 1.00% 2.93% 5.78% 2.83% 24 87 255 502 246 10,019,495 2.50% 184 10,241,161 2.22% 188 1,478,214,870 3.31% 288 37,004,173 2,990,714 4,927,453 9.22% 0.75% 1.23% 678 55 90 38,121,122 3,147,496 5,337,971 8.27% 0.68% 1.16% 699 58 98 4,557,985,513 380,476,830 749,038,865 10.21% 0.85% 1.68% 888 74 146 443,723,370 100.00% 402,933,943 90.81% 36,015,750 7.73% 0 0.00% 4,773,677 1.08% 8,134 7,386 660 0 88 745,137,816 100.00% 621,916,425 83.46% 36,015,750 5.07% 81,699,288 10.96% 5,506,353 0.74% 13,659 11,401 660 1,498 101 61,604,761,469 56,334,211,074 1,122,766,960 3,566,244,195 581,539,240 100.00% 100.00% 1.73% 5.79% 1.30% 11,998 10,971 219 695 113 336,601,212 100.00% 222,842,900 66.20% 5,537,917 1.65% 6,957,036 2.07% 63,303,202 18.81% 6,680,742 1.98% 4,201,500 1.25% 2,096,675 0.62% 1,835,635 0.55% 0 0.00% 57 0.00% 4,691,432 1.39% 8,621,053 2.56% 9,833,063 2.92% 6,170 4,085 102 128 1,160 122 77 38 34 0 0 86 158 180 366,230,316 100.00% 230,644,142 62.98% 5,537,917 1.51% 7,453,907 2.04% 74,873,816 20.44% 8,246,928 2.25% 5,017,018 1.37% 2,098,023 0.57% 1,835,635 0.50% 0 0.00% 3,534,052 0.96% 5,917,324 1.62% 8,621,053 2.35% 12,450,501 3.40% 6,714 4,228 102 137 1,373 151 92 38 34 0 65 108 158 228 33,337,172,280 19,882,619,780 394,615,167 1,184,907,278 5,066,610,853 1,738,349,914 880,288,537 127,698,362 202,732,055 23,191,202 1,816,342,310 860,275,208 380,228,185 779,313,429 100.00% 59.64% 1.18% 3.55% 15.20% 5.21% 2.64% 0.38% 0.61% 0.07% 5.45% 2.58% 1.14% 2.34% 6,493 3,872 77 231 987 339 171 25 39 5 354 168 74 152 Program Expenditures Operating Expenditures ‐ Program Regular Gifted and Talented Career and Technical Students with Disabilities Accelerated Education Bilingual Nondisc Alt Ed‐AEP Basic Serv Disc Alt Ed‐DAEP Basic Serv Disc Alt Ed‐DAEP Supplemental T1 A Schoolwide‐St Comp>=40% Athletics/Related Activities High School Allotment Prekindergarten District Instructional Expenditure Ratio State 69.9% 63.7% 1.1700 0.2830 1.4530 1.0725 0.1812 1.2538 Tax Rates 2013 (current tax year) Tax Rates Maintenance and Operations Interest and Sinking Funds Total Tax Rate 2012 Tax Year State Certified Property Values Property Value Property Value per pupil Property Value by category: Business Residential Land Oil and Gas Other Amount Percent 33,735,022,641 N/A 618,413 N/A Amount 1,766,822,499,104 358,703 Percent N/A N/A 12,361,869,191 23,482,242,595 463,093,169 0 117,605,719 682,214,492,680 1,055,132,999,498 120,643,570,625 128,013,368,497 10,341,459,606 34.17% 52.85% 6.04% 6.41% 0.52% 33.94% 64.47% 1.27% 0.00% 0.32% Percent of Total Budgeted Expenditures 2013‐2014 School Districts' General Fund Unassigned Fund Balance*** 2013‐2014 School Districts' General Fund Total Budgeted Expenditures 2013‐2014 School Districts' Percent of Total Budgeted Expenditures 154,251,239 10,079,251,575 415,891,870 38,592,012,767 37.1% 26.1% ** Fund balance percentages are calculated by dividing the fund balance by either the general revenue or all funds. The percentages illustrate the size of the fund balance in relation to total revenues. Charter schools report net assets rather than fund balances. *** The TEA does not have encumbrance data to subtract from the fund balances.


