College of San Mateo Official Course Outline COURSE ID: Units:
advertisement

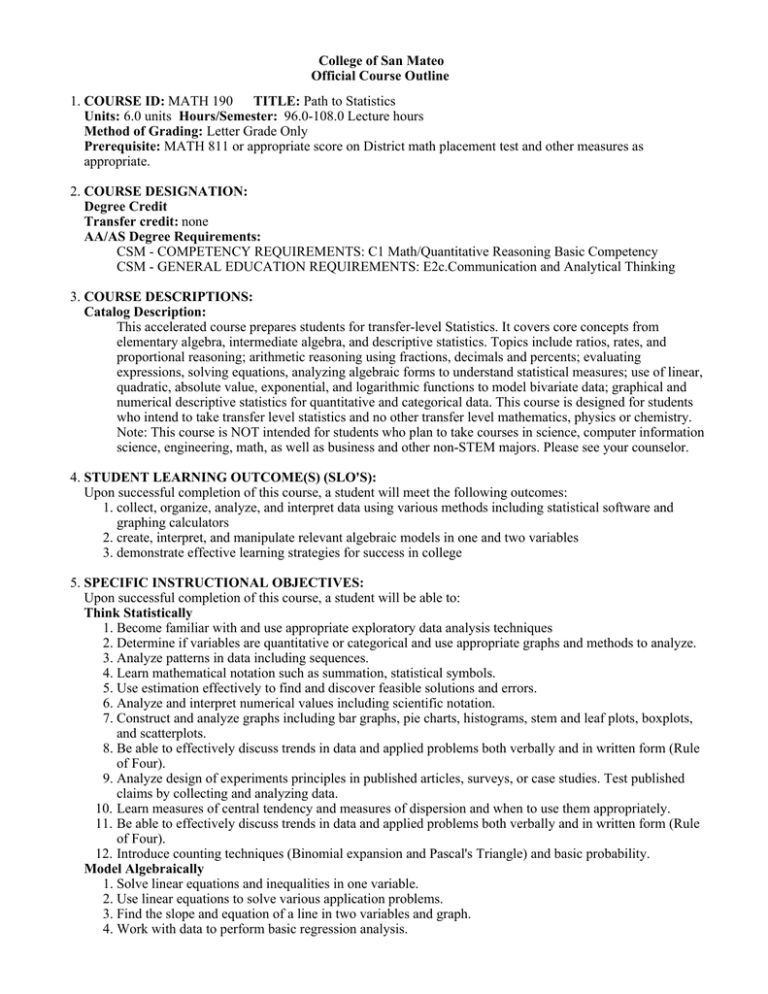
College of San Mateo Official Course Outline 1. COURSE ID: MATH 190 TITLE: Path to Statistics Units: 6.0 units Hours/Semester: 96.0-108.0 Lecture hours Method of Grading: Letter Grade Only Prerequisite: MATH 811 or appropriate score on District math placement test and other measures as appropriate. 2. COURSE DESIGNATION: Degree Credit Transfer credit: none AA/AS Degree Requirements: CSM - COMPETENCY REQUIREMENTS: C1 Math/Quantitative Reasoning Basic Competency CSM - GENERAL EDUCATION REQUIREMENTS: E2c.Communication and Analytical Thinking 3. COURSE DESCRIPTIONS: Catalog Description: This accelerated course prepares students for transfer-level Statistics. It covers core concepts from elementary algebra, intermediate algebra, and descriptive statistics. Topics include ratios, rates, and proportional reasoning; arithmetic reasoning using fractions, decimals and percents; evaluating expressions, solving equations, analyzing algebraic forms to understand statistical measures; use of linear, quadratic, absolute value, exponential, and logarithmic functions to model bivariate data; graphical and numerical descriptive statistics for quantitative and categorical data. This course is designed for students who intend to take transfer level statistics and no other transfer level mathematics, physics or chemistry. Note: This course is NOT intended for students who plan to take courses in science, computer information science, engineering, math, as well as business and other non-STEM majors. Please see your counselor. 4. STUDENT LEARNING OUTCOME(S) (SLO'S): Upon successful completion of this course, a student will meet the following outcomes: 1. collect, organize, analyze, and interpret data using various methods including statistical software and graphing calculators 2. create, interpret, and manipulate relevant algebraic models in one and two variables 3. demonstrate effective learning strategies for success in college 5. SPECIFIC INSTRUCTIONAL OBJECTIVES: Upon successful completion of this course, a student will be able to: Think Statistically 1. Become familiar with and use appropriate exploratory data analysis techniques 2. Determine if variables are quantitative or categorical and use appropriate graphs and methods to analyze. 3. Analyze patterns in data including sequences. 4. Learn mathematical notation such as summation, statistical symbols. 5. Use estimation effectively to find and discover feasible solutions and errors. 6. Analyze and interpret numerical values including scientific notation. 7. Construct and analyze graphs including bar graphs, pie charts, histograms, stem and leaf plots, boxplots, and scatterplots. 8. Be able to effectively discuss trends in data and applied problems both verbally and in written form (Rule of Four). 9. Analyze design of experiments principles in published articles, surveys, or case studies. Test published claims by collecting and analyzing data. 10. Learn measures of central tendency and measures of dispersion and when to use them appropriately. 11. Be able to effectively discuss trends in data and applied problems both verbally and in written form (Rule of Four). 12. Introduce counting techniques (Binomial expansion and Pascal's Triangle) and basic probability. Model Algebraically 1. Solve linear equations and inequalities in one variable. 2. Use linear equations to solve various application problems. 3. Find the slope and equation of a line in two variables and graph. 4. Work with data to perform basic regression analysis. 5. Use dimensional analysis to perform unit conversions. 5. Use dimensional analysis to perform unit conversions. 6. Solve problems involving ratios, proportions, and percents. 7. Use various algebraic concepts such as absolute value and the Pythagorean theorem. 8. Evaluate and solve various models such as linear, exponential, quadratic, logarithmic, and radical using the Rule of Four. 9. Analyze relationships between variables including direct and inverse variation. Learn Effectively 1. Attend class regularly and be punctual in turning in assignments. 2. Work productively with peers on group assignments. 3. Seek help from peers, instructor, and other resources when necessary. 6. COURSE CONTENT: Lecture Content: CATEGORICAL VARIABLES: Graphs of distributions of categorical data: bar charts and pie charts Constructing and reading bar charts and pie charts; Using fractions, decimals and percents to interpret bar charts and pie charts; Recognizing and generating equivalent forms of fractions, decimals, and percents; Comparing fractions with the same denominator; Comparing fractions, decimals, and percents. Contingency tables: marginal and conditional distributions Comparing fractions with different denominators; Comparing fractions, decimals, percents; Identifying fractions and percents that describe part of a whole (marginal distributions); Identifying fractions and percents that describe the impact of one quantity on another (conditional distributions). QUANTITATIVE VARIABLES: Measures of center and associated measures of spread: mean, variance, standard deviation; median, quartiles, percentiles Computing with and interpreting fractions, decimals, percents, signed numbers as they relate to these formulas and concepts; Evaluating expressions using the order of operations; Solving equations; Analyzing algebraic structures and forms to understand these measures. Analyzing algebraic structures geometrically. Geometric interpretations relate to why standard deviation is roughly an average distance from the mean and why positively associated data in a scatterplot gives positive correlation. Graphs of univariate distributions of quantitative data: histograms, stem-and-leaf plots, boxplots, Graphing fractions, decimals, and signed numbers on a number line; Evaluating expressions Relative vs. absolute difference Graphs and models for bivariate distributions of quantitative variables, including interpreting scatterplots using linear and logarithmic scales, use of least-squares regression, calculation and interpretation of correlation coefficient (r) and as measures of strength and spread in linear regression. A graph as the set of solutions to an equation; Graphing in the Cartesian coordinate system; Scatterplots; Functions; Linear functions, constant rate of change, graphing, interpreting slope and y-intercept in context; Solving equations; Proportions and linearity; Exponential functions, constant % change, graphing, interpreting initial value and growth or decay rates; Logarithmic scales. DATA PRODUCTION: Sample and sample statistic vs. population and population parameter Observation vs. experiment Principles of responsible survey and experiment design Purpose of randomization vs purpose of random sampling Simple random samples and other sampling designs Randomized comparative experiments, matched pairs and block designs Cautions about sample surveys and experimentation PROBABILITY Introduction to Probability Probability Rules Probability Distributions for Random Variables TOPICS RELATED TO DEVELOPING EFFECTIVE LEARNING SKILLS Study skills: for example, organization and time management, test preparation and test-taking skills Self-assessment: for example, using performance criteria to judge and improve one’s own work, analyzing and correcting errors on one’s test Use of resources: for example, strategies for identifying, utilizing, and evaluating the effectiveness of resources in improving one’s own learning, e.g. peer study groups, computer resources, lab services Lab Content: Not applicable. TBA Hours Content: Not applicable. 7. REPRESENTATIVE METHODS OF INSTRUCTION: Typical methods of instruction may include: A. Lecture B. Activity C. Directed Study D. Discussion E. Individualized Instruction F. Observation and Demonstration 8. REPRESENTATIVE ASSIGNMENTS Representative assignments in this course may include, but are not limited to the following: Writing Assignments: Students will write the following essays: Describe how some news articles misrepresent statistics. Compare and contrast observational studies and controlled experiments. Describe how the four major themes of shape, center, spread, and outliers relate to statistical diagrams, numerical measures, probability, and regression. Describe how two or more variables can be compared using statistical diagrams, numerical measures, and regression. Reading Assignments: Students will read: Case Studies News articles for relevent material Textbook Other Outside Assignments: Other assginments include: Homework from the textbook and handouts including the use of technology. Group projects: eg. Collecting, analyzing, and presenting data. To be Arranged Assignments: Not applicable. 9. REPRESENTATIVE METHODS OF EVALUATION Representative methods of evaluation may include: A. Class Participation B. Class Performance C. Class Work D. Exams/Tests E. Group Projects F. Homework G. Oral Presentation H. Papers I. Portfolios J. Projects K. Quizzes L. Research Projects 10. REPRESENTATIVE TEXT(S): Possible textbooks include: A. Bennet, Briggs, Triola. Statistical Reasoning for Everyday Life. , 3 ed. Pearson, 2010 B. Illowsky, B., Dean, S. . Collaborative Statistics , 2 ed. 20mm Foundation, 2012 C. Lehmann, J.. Elementary and Intermediate Algebra: Functions & Authentic Application, Custom ed. Prentice Hall, 2010 Origination Date: May 2014 Curriculum Committee Approval Date: October 2014 Effective Term: Fall 2015 Course Originator: John Lehmann


