Proceedings of the Tenth International AAAI Conference on
Web and Social Media (ICWSM 2016)
Deciphering the 2016 U.S. Presidential Campaign in the
Twitter Sphere: A Comparison of the Trumpists and Clintonists
Yu Wang
Yuncheng Li
Jiebo Luo
Political Science
University of Rochester
Rochester, NY 14627
ywang@ur.rochester.edu
Computer Science
University of Rochester
Rochester, NY 14627
yli@cs.rochester.edu
Computer Science
University of Rochester
Rochester, NY 14627
jluo@cs.rochester.edu
Abstract
In this paper, we study follower demographics of Donald
Trump and Hillary Clinton, the two leading candidates in
the 2016 U.S. presidential race. We build a unique dataset
US2016, which includes the number of followers for each
candidate from September 17, 2015 to December 22, 2015.
US2016 also includes the geographical location of these followers, the number of their own followers and, very importantly, the profile image of each follower. We use individuals’ number of followers and profile images to analyze four
dimensions of follower demographics: social status, gender,
race and age. Our study shows that in terms of social influence, the Trumpists are more polarized than the Clintonists:
they tend to have either a lot of influence or little influence.
We also find that compared with the Clintonists, the Trumpists are more likely to be either very young or very old. Our
study finds no gender affinity effect for Clinton in the Twitter
sphere, but we do find that the Clintonists are more racially
diverse.
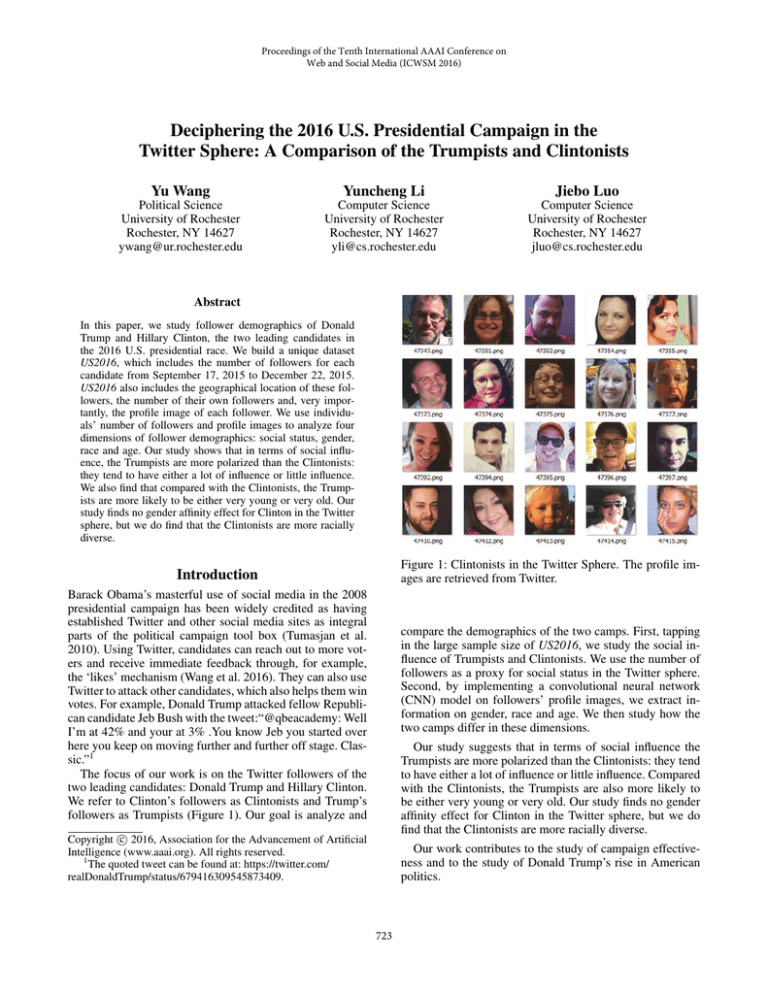
Figure 1: Clintonists in the Twitter Sphere. The profile images are retrieved from Twitter.
Introduction
Barack Obama’s masterful use of social media in the 2008
presidential campaign has been widely credited as having
established Twitter and other social media sites as integral
parts of the political campaign tool box (Tumasjan et al.
2010). Using Twitter, candidates can reach out to more voters and receive immediate feedback through, for example,
the ‘likes’ mechanism (Wang et al. 2016). They can also use
Twitter to attack other candidates, which also helps them win
votes. For example, Donald Trump attacked fellow Republican candidate Jeb Bush with the tweet:“@qbeacademy: Well
I’m at 42% and your at 3% .You know Jeb you started over
here you keep on moving further and further off stage. Classic.”1
The focus of our work is on the Twitter followers of the
two leading candidates: Donald Trump and Hillary Clinton.
We refer to Clinton’s followers as Clintonists and Trump’s
followers as Trumpists (Figure 1). Our goal is analyze and
compare the demographics of the two camps. First, tapping
in the large sample size of US2016, we study the social influence of Trumpists and Clintonists. We use the number of
followers as a proxy for social status in the Twitter sphere.
Second, by implementing a convolutional neural network
(CNN) model on followers’ profile images, we extract information on gender, race and age. We then study how the
two camps differ in these dimensions.
Our study suggests that in terms of social influence the
Trumpists are more polarized than the Clintonists: they tend
to have either a lot of influence or little influence. Compared
with the Clintonists, the Trumpists are also more likely to
be either very young or very old. Our study finds no gender
affinity effect for Clinton in the Twitter sphere, but we do
find that the Clintonists are more racially diverse.
c 2016, Association for the Advancement of Artificial
Copyright Intelligence (www.aaai.org). All rights reserved.
1
The quoted tweet can be found at: https://twitter.com/
realDonaldTrump/status/679416309545873409.
Our work contributes to the study of campaign effectiveness and to the study of Donald Trump’s rise in American
politics.
723
Table 1: Profile Images in US2016
Literature Review
Our work builds upon previous research in electoral studies
and in computer vision.
In eletoral studies, researchers have found that race and
gender constitute two important factors in voting behavior.
One common observation is that women tend to vote for
women, which is usually referred to as gender affinity effect (King and Matland 2003; Dolan 2008). In our work, we
will test if women tend to follow Hillary Clinton on Twitter.
As for race, analysis by (Ansolabehere and Stewart 2009)
shows that Barack Obama won the 2008 presidential election because of his support among African Americans. Using 2008 American National Election Studies survey data,
(Piston 2010) shows that negative stereotypes about blacks
significantly eroded white support for Obama. In this study,
we will analyze the racial composition of the Clintonists and
the Trumpists.
Our work also ties in with current computer vision research, as the profile images of the followers constitute an
integral part of our US2016 dataset. In this dimension, our
work is related to gender, race and age classification using
facial features. (Fu, He, and Hou 2014) provides a comprehensive survey of race classification based on facial features.
(Levi and Hassner 2015) uses a five-layer network to classify both age and gender. Here we are inspired by (Ginosar
et al. 2015) to explore the riches of followers’ profile images. To our knowledge, our work is the first to use Twitter
users’ profile images for gender classification.
Democratic Candidates
Hillary Clinton 28, 771
Bernie Sanders 20, 000
Republican Candidates
Ben Carson
20, 000
Donald Trump 29, 520
This dataset will be used for training our CNN model. In the
MORPH database, there are only 154 Asian faces. We decide to drop that class. In the training and validation stages,
we only use White, Black and Hispanic images. So the classifier will only have these three classes.
For classifying images based on gender and race, we
use the Caffe implementation of the ImageNet architecture
that was pre-trained on the ILSVRC dataset (Krizhevsky,
Sutskever, and Hinton 2012). Using the MORPH dataset,
we find that the CNN model performs better than if we use
either non-negative matrix factorization or principal component analysis to extract features and use SVM for classification. The Mean Average Precision (MAP) we achieve for
gender classification is 99.8%. For race, it is 95.6%.4
For lack of data to train the multiple age classes, we decide that for the purpose of age classification, we use the
software service from Face++.5
Empirical Results
In this section, we first study the distribution of social influence of the two camps. We then investigate the gender, racial
and age composition of Clintonists and Trumpists, and analyze their differences.
Data Collection and Pre-Processing
In this section, we describe our dataset US2016 and the preprocessing procedures. One variable is number of followers.
This variable is available for both candidates and covers the
entire period from Sept. 17, 2015 to Dec. 22, 2015. For each
candidate’s followers we also have data on user name, number of followers, geographical information and profile images.
In particular, we use the number of followers as a proxy
for social status, assuming that individuals with a larger
number of followers possess a higher social status.2 We derive from the profile images the followers’ demographic information, such as age, gender and race.
To process the profile images, we first use OpenCV to
identify faces, as the majority of profile images only contain a face. We discard images that do not contain a face and
the ones in which OpenCV is not able to detect a face. When
multiple faces are available, we choose the largest one. Out
of all facial images thus obtained, we select only the large
ones. Here we set the threshold to 25kb. Lastly we resize
those images to (256, 256). In Table 1, we report the summary statistics of the images in US2016.
Our training data comes from MORPH database.3 It has
detailed labels on gender, race and age for 55,134 samples.
Followers’ Social Status
In this subsection, we study the social influence of the Clintonists and the Trumpists. One way to measure social status
is income, and there already exists research that predicts income based on user-generated tweets (Preotiuc-Pietro et al.
2015). Here we propose an alternative measure: the number of followers on Twitter. This is partly because we see a
positive correlation between social status and the number of
followers and partly because the subject of interest here is a
follower of either presidential candidate.
Figure 2: Trump leads in both Tails.
2
A PageRank approach would require computing weights for
each Twitter user. Here we adopt the simpler counting method.
3
For
summary
statistics,
please
see
http://people.uncw.edu/vetterr/MORPH-NonCommercialStats.pdf.
4
We randomly sample 40,000 images for training and use the
rest for validation.
5
http://www.faceplusplus.com/.
724
Figure 3: Clinton leads in the Middle.
Figure 4: Gender Composition
We find that individuals with only a few followers and individuals with hundreds of followers make up a larger share
in the Trump camp than in the Clinton camp, while by contrast individuals with a few dozen to two hundred followers
have a larger presence among the Clintonists.
The main reading is that in the Twitter sphere we have not
detected any gender affinity effect. The percentage of female followers for Clinton is not larger than that for Donald
Trump. This also means that Trump has strong female support and that apparently Trump’s feud with Megyn Kelly has
not alienated female voters.
Gender
Race
In this subsection, we analyze the gender composition of
Trump’s and Clinton’s followers. As reported in Section 3,
we train a CNN model using the MORPH database and use
the trained model to classify Twitter profile images.
A number of studies have demonstrated the “gender affinity effect” in American elections (Brians 2005;
Herrnson, Lay, and Stokes 2003). In the first Democratic
public debate in October, 2015, Hillary Clinton also emphasized her identity as a woman: “Being the first woman
president would be quite a change from the presidents we’ve
had, including President Obama.”6 Clinton is certainly enjoying the support of her fellow female politicians. Out of
14 female Democratic senators, 13 have endorsed Clinton’s
presidential campaign.7 But there is also strong evidence
that shows Clinton’s support among average Democratic
women has fallen sharply.8 This makes our investigation in
the Twitter sphere particularly interesting.
In this subsection, we analyze the racial composition of
Trump’s and Clinton’s followers. Research of 2008 exit poll
data has shown that Barack Obama won the presidential
election because of his race rather than despite his race. Ethnic minorities, such as African Americans and Hispanics,
tend to vote for the Democrats (Stewart and Ansolabehere,
2009). Here our goal is to explore this phenomenon in the
Twitter sphere.
In Figure 5, we report the calculated racial composition
of the Clintonists and the Trumpists. Our results show that a
Clintonist is more likely to be an African American or Hispanic than a Trumpist is. A Trumpist has a higher probability
to be white than a Clintonist. This pattern in Twitter sphere
is consistent with historical voting patterns.
Table 2: Score Test on Gender Composition
Null Hopythesis
pc =pt
Female
z statistic
p value
-0.11
0.46
We report the findings in Figure 4 and the score test statistic in Table 2, where pc denotes probability among the Clintonists and pt denotes the probability among the Trumpists.9
Figure 5: Racial Composition
6
http://www.huffingtonpost.com/entry/hillary-clinton-firstwoman-president 561dbf71e4b028dd7ea5af6c.
7
http://www.cnn.com/2015/11/30/politics/hillary-clintonelizabeth-warren-fundraiser.
8
https://www.washingtonpost.com/politics/pollsharp-erosion-in-clinton-support-among-democraticwomen/2015/09/14/6406e2a0-58c3-11e5-b8c9944725fcd3b9 story.html.
9
The formula for the score test statistic is: z
=
To test the significance of the differences in racial composition, we calculate score test statistic for each race and
report them in Table 5.10 We find these differences in followers’ racial composition statistically significant.
√
p̂1 −p̂2
p̂(1−p̂)(1/n1 +1/n2 )
10
, where p̂1 =
x
,
n1
p̂2 =
y
,
n2
In the test of each race, we treat it as binary.
725
p=
x+y
.
n1 +n2
Table 3: Score Test on Racial Composition
Null
pc =pt
Black
z statistic
17.1
p
0
Hispanic
z statistic p
10.1
0
White
z statistic
-20.7
in the Twitter sphere, but we do find that the Clintonists are
more racially diverse.
p
0
Acknowledgment
We gratefully acknowledge support from the University of
Rochester, New York State through the Goergen Institute for
Data Science, and our corporate sponsors Xerox and Yahoo.
Age
References
In this subsection, we study the age distribution of the candidates’ followers. A stereotypical idea is that the Republican
supporters tend to be old white people. Also for this reason,
the Republican party is considered to be in a demographic
crisis as its supporters are gradually passing away.
We explore this demographic question by estimating the
ages of the candidates’ followers. We report our results in
Figure 6. Consistent with real world voting, we find that
older people aged above 40 make up a larger share in the
Trump camp than in the Clinton trump. We also find that
followers of a very young age (1-17) also make up a larger
share in the Trump camp. But notice that these very young
people are not eligible for voting yet. For followers aged between 18 and 40, they occupy a larger presence among the
Clintonists than among the Trumpists.
Using score test we are able to show that the Clintonists
in the Twitter sphere are statistically more likely to be in the
18-40 age group than the Trumpists and less likely to be in
either the 1-17 age group or the 41-66 age group (Table 4).
Ansolabehere, S., and Stewart, C. 2009. Amazing Race:
How post-racial was Obamas victory? Boston Review.
Brians, C. L. 2005. Women for Women? Gender and Party
Bias in Voting for Female Candidates. American Politics
Research.
Dolan, K. 2008. Is There a Gender Affinity Effect in American Politics? Information, Affect, and Candidate Sex in U.S.
House Elections. Political Research Quarterly.
Fu, S.; He, H.; and Hou, Z.-G. 2014. Learning Race from
Face: A Survey. In Pattern Analysis and Machine Intelligence, IEEE Transactions on, volume 36.
Ginosar, S.; Rakelly, K.; Sachs, S.; Yin, B.; and Efros, A. A.
2015. A Century of Portraits: A Visual Historical Record of
American High School Yearbooks. In ICCV 2015 Extreme
Imaging Workshop Proceedings.
Herrnson, P. S.; Lay, J. C.; and Stokes, A. K. 2003.
Women Running as Women: Candidate Gender, Campaign
Issues, and Voter-Targeting Strategies. Journal of Politics
65(1):244–255.
King, D. C., and Matland, R. E. 2003. Sex and the
Grand Old Party: An Experimental Investigation of the Effect of Candidate Sex on Support for a Republican Candidate. American Politics Research.
Krizhevsky, A.; Sutskever, I.; and Hinton, G. E. 2012. ImageNet Classification with Deep Convolutional Neural Networks. In Advances in Neural Information Processing Systems 25 (NIPS 2012).
Levi, G., and Hassner, T. 2015. Age and Gender Classification using Deep Convolutional Neural Networks. In Proceedings of the IEEE Conference on Computer Vision and
Pattern Recognition, 3442.
Piston, S. 2010. How Explicit Racial Prejudice Hurt Obama
in the 2008 Election. Political Behavior 32(8):431–451.
Preotiuc-Pietro, D.; Volkova, S.; Lampos, V.; Bachrach, Y.;
and Aletras, N. 2015. Studying User Income through Language, Behaviour and Affect in Social Media. PLoS ONE
10(9).
Tumasjan, A.; Sprenger, T. O.; Sandner, P. G.; and Welpe,
I. M. 2010. Predicting Elections with Twitter: What 140
Characters Reveal about Political Sentiment. In Proceedings of the Fourth International AAAI Conference on Weblogs and Social Media.
Wang, Y.; Luo, J.; Niemi, R.; Li, Y.; and Hu, T. 2016. Catching Fire via ’Likes’: Inferring Topic Preferences of Trump
Followers on Twitter. In Tenth International AAAI Conference on Web and Social Media.
Table 4: Score Test of Age Composition
Null
pc =pt
1-17
18-40
41-66
z statistic p
z statistic p z statistic p
-3.1
0.002 8.9
0 -9.1
0
Figure 6: Age Distribution
Conclusions
In this study, we have analyzed four dimensions of follower
demographics: social influence, gender, race and age. With
respect to social influence, we find that Trump’s followers
are more likely to find themselves in the tails of the distribution, while Clinton followers are more likely to appear in
the middle. The same pattern also holds in the age dimension. Our study finds no gender affinity effect for Clinton
726


