Commodity Data Sheet Green Peas
advertisement
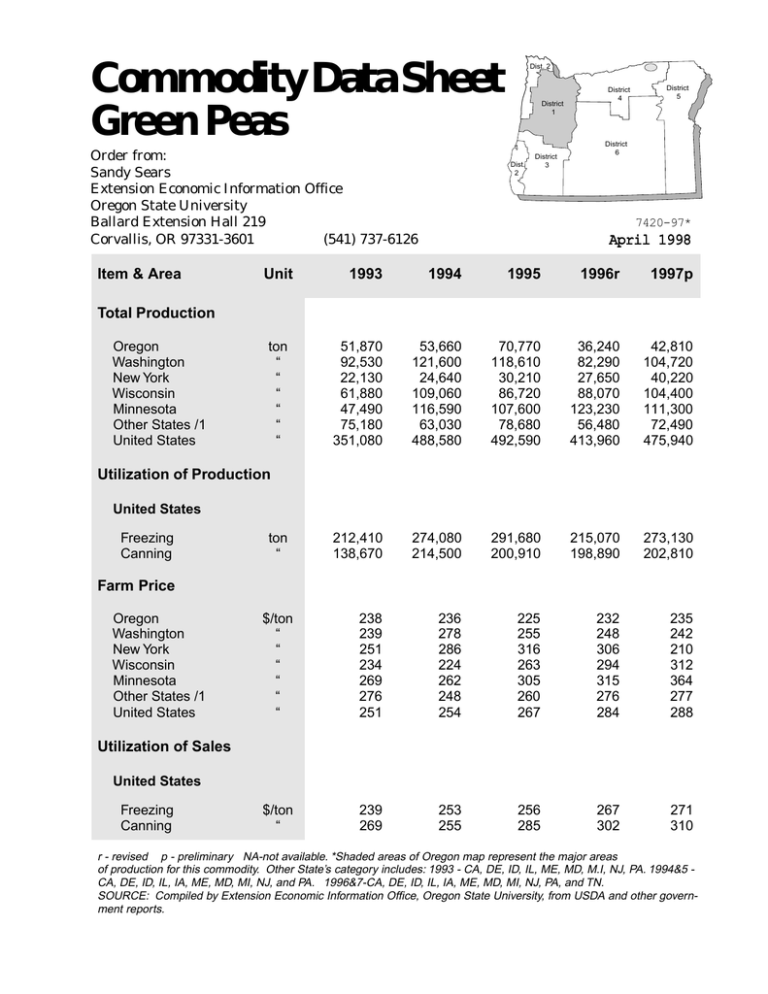
Commodity Data Sheet Green Peas Order from: Sandy Sears Extension Economic Information Office Oregon State University Ballard Extension Hall 219 Corvallis, OR 97331-3601 (541) 737-6126 Item & Area Unit Dist. 2 District 1 Dist. 2 District 3 District 4 District 5 District 6 7420-97* April 1998 1993 1994 1995 1996r 1997p 51,870 92,530 22,130 61,880 47,490 75,180 351,080 53,660 121,600 24,640 109,060 116,590 63,030 488,580 70,770 118,610 30,210 86,720 107,600 78,680 492,590 36,240 82,290 27,650 88,070 123,230 56,480 413,960 42,810 104,720 40,220 104,400 111,300 72,490 475,940 212,410 138,670 274,080 214,500 291,680 200,910 215,070 198,890 273,130 202,810 $/ton “ “ “ “ “ “ 238 239 251 234 269 276 251 236 278 286 224 262 248 254 225 255 316 263 305 260 267 232 248 306 294 315 276 284 235 242 210 312 364 277 288 $/ton “ 239 269 253 255 256 285 267 302 271 310 Total Production Oregon Washington New York Wisconsin Minnesota Other States /1 United States ton “ “ “ “ “ “ Utilization of Production United States Freezing Canning ton “ Farm Price Oregon Washington New York Wisconsin Minnesota Other States /1 United States Utilization of Sales United States Freezing Canning r - revised p - preliminary NA-not available. *Shaded areas of Oregon map represent the major areas of production for this commodity. Other State’s category includes: 1993 - CA, DE, ID, IL, ME, MD, M.I, NJ, PA. 1994&5 CA, DE, ID, IL, IA, ME, MD, MI, NJ, and PA. 1996&7-CA, DE, ID, IL, IA, ME, MD, MI, NJ, PA, and TN. SOURCE: Compiled by Extension Economic Information Office, Oregon State University, from USDA and other government reports. GREEN PEAS FOR PROCESSING BY COUNTIES, OREGON, 1994-97p County Marion Umatilla Harvested Acres 1994 1995 1996r 1997p 1,160 31,250 acres 1,400 490 27,600 18,665 1994 Yield per Acre 1995 1996r 1997p tons 700 24,590 1.9 1.4 2.4 2.0 1.7 1.5 2.0 1.4 Other Co. 4,090 4,700 2,945 2,510 2.3 2.9 2.2 2.7 State Total 36,500 33,700 22,100 27,800 1.5 2.1 1.6 1.5 County 1994 Production Sold 1995 1996r 1997p 1994 Tons Marion Umatilla Value of Sales 1995 1996r 1997p thousand dollars 2,200 42,090 3,350 53,800 842 28,875 1,380 34,620 Other Co. 9,370 13,620 6,523 6,810 State Total 53,660 70,770 36,240 42,810 475 685 10,136 12,302 2,053 2,936 12,664 15,923 190 6,766 283 8,326 1,452 1,451 8,408 10,060 $26,000 75,000 $24,000 70,000 $22,000 65,000 $20,000 60,000 $18,000 55,000 Production $16,000 50,000 $14,000 45,000 $12,000 40,000 $10,000 Production (000 tons) Value of Sales ($000) Oregon Green Peas for Processing 35,000 Value of Sales $8,000 $6,000 Year % U.S. Production 30,000 25,000 1980 1981 1982 1983 1984 1985 1986 1987 1988 1989 1990 1991 1992 1993 1994 1995 1996 1997 11.2 9.7 7.4 9.5 10.0 7.5 12.1 10.1 8.4 10.5 8.3 12.6 6.6 14.7 11.0 14.4 8.8 9.0 Source: Compiled by the Extension Economic Information Office, Oregon State University. Oregon State University Extension Service offers educational programs, activities, and materials--without regard to race, color, national origin, sex, age, or disability--as required by the Title VI of Civil Rights Act of 1964, Title IX of the Education Amendments of 1972, and Section 504 of the Rehabilitation Act of 1973. Oregon State University Extension Service is an Equal Opportunity Employer.
