Commodity Sheet
advertisement
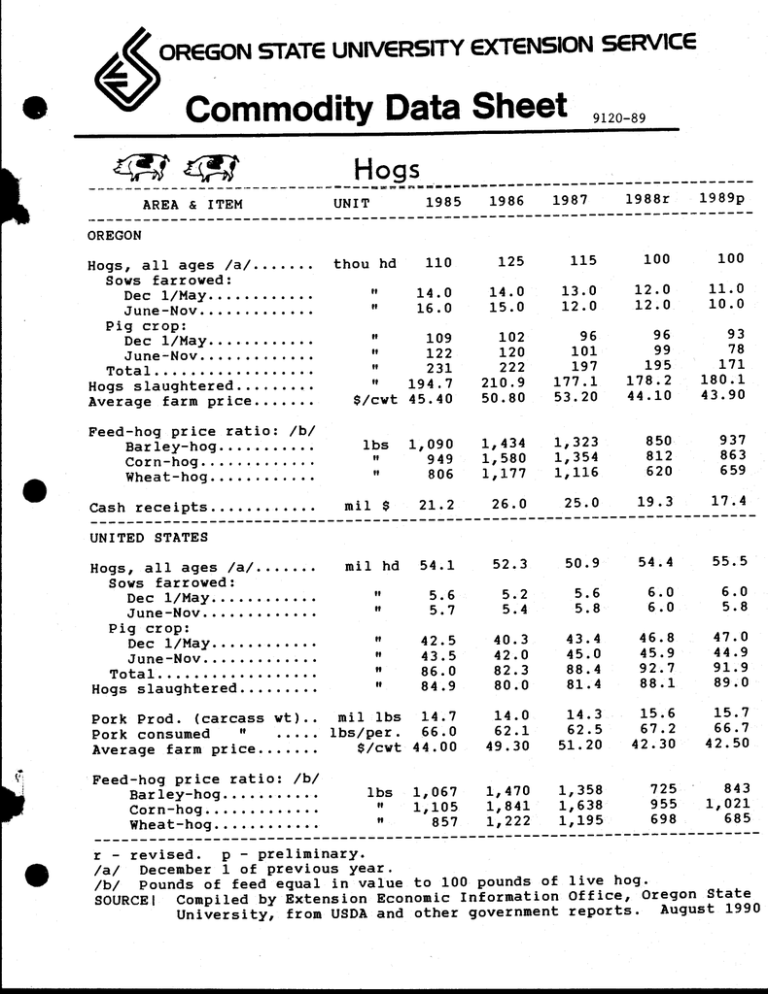
L OREGON STATE UNIVERSITY EXTENSION SERVICE Commodity Data Sheet 4j4W AREA 'J & 9120 -89 Hogs ITEM 1988r 1989p 115 100 100 14.0 15.0 13.0 12.0 12.0 12.0 11.0 10.0 102 120 222 210.9 50.80 96 101 197 177.1 96 99 93 78 195 178.2 44.10 180.1 43.90 949 806 1,434 1,580 1,177 1,323 1,354 1,116 850 812 620 937 863 659 21.2 26.0 25.0 19.3 17.4 54.1 52.3 50.9 54.4 55.5 5.6 5.7 5.2 5.4 5.6 5.8 6.0 6.0 6.0 5.8 42.5 43.5 86.0 84.9 40.3 42.0 82.3 80.0 43.4 45.0 88.4 81.4 46.8 45.9 92.7 88.1 47.0 44.9 91.9 89.0 14.7 mil lbs 66.0 lbs /per. $ /cwt 44.00 14.0 62.1 49.30 14.3 62.5 51.20 15.6 67.2 42.30 15.7 66.7 42.50 " 857 1,470 1,841 1,222 1,358 " 1,067 1,105 725 955 698 843 1,021 685 1986 UNIT 1985 thou hd 110 125 14.0 16.0 109 122 231 1987 OREGON Hogs, all ages /a/ Sows farrowed: Dec 1 /May June -Nov Pig crop: Dec 1 /May June -Nov Total Hogs slaughtered Average farm price Feed -hog price ratio: /b/ Barley -hog.... ...... Corn -hog Wheat -hog " " n " " $ /cwt 194.7 45.40 lbs 1,090 " er " mil Cash receipts $ 53.20 171 UNITED STATES Hogs, all ages /a/ Sows farrowed: Dec 1 /May June -Nov Pig crop: Dec 1 /May June -Nov Total Hogs slaughtered Pork Prod. (carcass wt) Pork consumed " Average farm price Feed -hog price ratio: /b/ Barley -hog .... Corn -hog Wheat -hog mil hd " " " " " " lbs 1,638 1,195 p - preliminary. - revised. December 1 of previous year. /a/ /b/ Pounds of feed equal in value to 100 pounds of live hog. Compiled by Extension Economic Information Office, Oregon State SOURCEI University, from USDA and other government reports. August 1990 r HOGS Production, Marketings, Price, and Value, Oregon. Year /a/ Production (000 lbs) Total Mktg.s (000 Price /b/ cwt lbs) '. $SS 1940 -1989p Value of Cash /c/ recpts home consump (000 $) Gross inc. (000 $) (000 $) 5,436 1940.. 84,015 73,200 1950.. 51,248 46,848 20.10 10,405 1,141 11,546 1955.. 1956.. 1957.. 1958.. 1959.. 54, 619 49,828 47,042 49,905 62,630 45,629 46,973 43,692 38,580 54,840 17.50 16.20 19.80 21.80 16.30 8,162 7,749 8,753 8,544 9,074 925 754 757 9,087 8,503 9,510 9,664 10,109 1960.. 1961.. 1962.. 1963.. 1964.. 54,520 57,265 54,474 51,211 43,825 49,320 51,225 8,342 9,369 9,393 8,388 6,955 893 51,216 42,930 16.70 18.10 17.70 16.30 16.10 797 554 511 9,235 10,490 10,190 8,942 7,466 1965.. 1966.. 1967.. 1968.. 1969.. 39,068 41,981 43,642 41,570 35,623 37,753 36,966 41,997 39,618 34,394 20.10 25.70 20.20 19.30 22.20 7,588 9,500 8,483 7,646 7,635 570 755 568 425 488 8,158 10,255 9,051 8,071 8,123 1970.. 1971.. 1972.. 1973.. 1974.. 36,740 37,031 35,852 34,440 37,044 32,993 34,013 33,257 33,148 35,858 23.80 7,852 684 17.40 5,918 25.10 37.80 6,458 693 34.00 8,348 12,530 12,192 540 1,130 799 9,041 13,660 12,991 1975.. 1976.. 1977.. 1978.. 1979.. 34,489 32,860 34,885 31,473 30,248 31,130 28,120 36,945 45.00 45.50 38.10 46.30 42.80 14,179 13,763 11,878 13,044 15,828 1,266 1,177 1,080 1,146 1,483 15,445 14,940 12,958 14,190 17,311 36.30 44.20 53.70 49.10 48.00 15,901 17,454 22,594 23,077 23,848 1,617 1,044 1,450 1,050 1,331 17,518 18,498 24,044 24,127 25,179 45.40 50.80 53.20 44.10 43.90 21,186 25,932 24,951 19,263 17,441 1,438 22,624 26,770 26,121 19,845 18,165 1980.. 1981.. 1982.. 1983.. 1984.. 1985.. 1986.. 1987.. 1988.. 1989p. 31,550 41,241 52, 584 39,609 45,326 49,991 53,718 43,750 39,488 42,075 46,999 49,683 52,025 51,092 46,604 44,739 40,106 46,666 51,048 46,900 43,680 39,730 48, 314 6.00 - 4,877 559 1,120 1,035 1,121 838 1,170 582 724 ' " 8,536 revised. p - preliminary. Adjustments made for changes in inventory and for inshipments. Excludes custom slaughter for use on farms where produced and interfarm sales within the state. Receipts /c/ from marketings and sale of farm slaughter. Includes allowance for higher average price of state outshipments of feeder pigs. SOURCE: Compiled by Extension Economic Information Office, Oregon State University, from USDA and other government reports. August, 1990 r - /a/ /b/ VALUE OF HOGS SOLD, BY COUNTIES. OREGON 1983 -1989p (9120 -89) Dist. -County & 1984 State 1986 1985 1987r 1989r 1989p thousand dollars Benton Clackamas Lane Linn Marion Multnomah Polk Washington Yamhill District Clatsop Columbia Coos Curry Lincoln Tillamook District Douglas Jackson Josephine District s Gilliam Hood River Morrow Sherman Umatilla Wasco Wheeler District Baker Malheur Union Wallowa District Crook Deschutes Grant Harney Jefferson Klamath Lake District 706 424 407 2,000 3,412 1,971 705 2,793 431 2,230 3,066 3,404 91 588 74 569 2,400 3,436 2,530 1 15,587 59 59 82 47 6 26 2 3 279 1,118 5 3,754 77 62 40 601 532 1,806 2,793 13,587 2,882 15,500 2,071 2,134 11,714 1,742 2,075 10,880 52 55 59 94 106 43 78 10 33 380 40 42 41 21 18 22 184 40 85 74 98 96 96 -37 401 148 763 895 115 1,773 434 666 98 1,198 151 361 166 678 147 340 137 624 65 259 10 82 78 343 23 324 42 414 -- 189 52 177 10 2,957 506 3,640 913 355 47 395 18 3,739 763 3,230 424 2,857 498 -22 257 1,346 48 319 1,819 160 998 3,195 752 1,444 2,824 322 1,901 197 1,267 3,159 705 2,524 3,169 16,038 547 712 282 577 2,789 393 1,852 77 506 847 91 12 65 4 635 2,266 87 6 - 2,424 47 20 43 50 4,396 3,823 5,122 5,367 42 4,476 39 29 10 10 20 29 3,812 56 56 59 247 706 112 263 690 106 330 868 172 60 336 856 218 50 301 959 192 301 796 179 1,121 1,115 1,429 1,470 1,502 1,313 212 261 208 307 55 234 311 112 63 288 109 196 201 121 102 245 101 135 151 116 149 86 43 72 213 50 221 48 49 1,015 31 709 664 24,951 19,263 17,441 65 35 282 104 50 307 87 .. 6 62 44 1,021 1,058 STATE TOTAL. 23,848 21,186 73 1,190 25,932 - revised. p - preliminary. SOURCE: Compiled by Extension Economic Information Office, OSU. 37 39 19 r 8/90 HOGS, ALL AGES, ON OREGON FARMS, BY COUNTIES District & County 1960 /a/ 1970 -number of head3,000 3,200 19,500 9,500 7,700 1,500 12,500 4,000 25, 500 18,000 2,900 1,600 Benton Clackamas Lane Linn Marion Multnomah Polk Washington Yamhill District 5,000 8,000 1 89,800 54,800 200 1,500 100 300 200 500 2 600 3,000 800 500 600 1,400 6,900 2,800 2,300 1,300 3 5,000 4,700 3,700 13,400 900 800 2,900 1,200 500 100 200 Clatsop Columbia Coos Curry Lincoln Tillamook District Douglas Jackson Josephine District Gilliam Hood River Morrow Sherman Umatilla Wasco Wheeler District 4,000 3,500 8,700 6,500 .. 500 4,100 1986 1989p 4110- 2,600 10,000 1,000 6,000 15,500 - 300; 3,00 11,000 11,500 60,900 200 400 500 500 500 100 200 300 300 300 100 200 200 2,200 2,200 1,400 1,400 3,500 3,800 600 7,900 2,000 2,800 500 5,300 1,000 2,000 800 3,800 1,000 2,000 400 500 2,500 2,000 1, 400 300 1,500 200 16,500 5,000 1,600 200 16,000 1,500 100 15,000 3,000 5 5,500 8,500 10,400 9,000 33,400 3,100 4,300 7,500 4,500 19,400 2,000 2,700 2,000 6 2,000 3,900 800 13,900 400 500 400 200 900 1,200 100 3,700 6,100 STATE TOTAL. 184,000 108,000 125,000 500 1988r . 300 4 O 1 number of head 3,200 2,700 12,500 10,000 1,9001,200 8,500 6,000 16,000 15,000 400 300 3,200 3,100 11,000 10,500 13,000 11,500 69,700 60,300 500 600 500 100 1,300 18,000 2,700 400 23,200 Crook Deschutes Grant Harney Jefferson Klamath Lake District 1987r 3,400 13,500 2,000 11,500 16,500 400 3,200 12,000 15,500 78,000 12,500 7,000 1,300 26,600 Baker Malheur Union Wallowa District December 4,000 300 300 300 100 200 200 - 800 3,800 3 1,000 100 14,500 3,500 300 300 200 24,400 25,000 22,100 21,100 300 1, 400 800 4,300 1,300 7,800 1,800 4,500 1,300 8,000 700 1,000 500 700 1,100 300 1,500 3,900 1,700 4,200 700 1,000 7,200 6,400 1,100 1,600 600 900 1,200 600 600 1,400 400 1,400 600 400 ' - 200 400 500 500 400 300 1,400 400 300 5,600 4,600 4,800 115,000 100,000 100,000 400 1,400 400 300 Al - revised. p - preliminary. /a/ January 1. SOURCE: Compiled by Extension Economic Information Office, Oregon State University. August, 1990 r El
