cus tomer c ase s tudy
Louisiana State University Health Sciences Center Visualizes Cancer Research
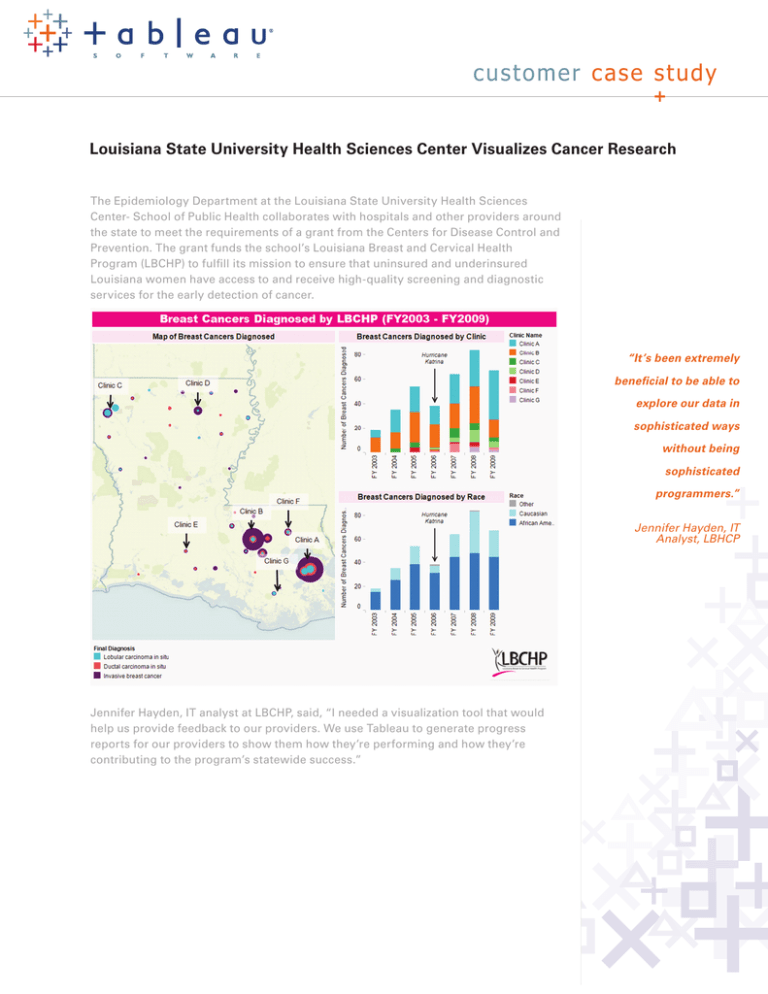
The Epidemiology Department at the Louisiana State University Health Sciences
Center- School of Public Health collaborates with hospitals and other providers around
the state to meet the requirements of a grant from the Centers for Disease Control and
Prevention. The grant funds the school’s Louisiana Breast and Cervical Health
Program (LBCHP) to fulfill its mission to ensure that uninsured and underinsured
Louisiana women have access to and receive high-quality screening and diagnostic
services for the early detection of cancer.
“It’s been extremely
beneficial to be able to
explore our data in
sophisticated ways
without being
sophisticated
programmers.”
Jennifer Hayden, IT
Analyst, LBHCP
Jennifer Hayden, IT analyst at LBCHP, said, “I needed a visualization tool that would
help us provide feedback to our providers. We use Tableau to generate progress
reports for our providers to show them how they’re performing and how they’re
contributing to the program’s statewide success.”
Identif ying Outliers for Quality Control
In addition to giving feedback to providers, LBCHP has found Tableau useful for
quality control by looking for outliers in their data. “If a provider is having a problem
in a given indicator, we’ve created visualizations to understand it: why is it happening
and how is it happening? We’ll look at how many individuals are falling outside of the
indicator. For example, in our breast rescreening project we looked at who comes
back for rescreening. Who are the women who are extending their time longer than
the recommended 18 months for rescreening mammograms? We dig deep into patient
info for quality control, finding trends, and working on program evaluation.”
“We always try to take
action based on the
results.”
Jennifer Hayden, IT
Analyst, LBHCP
“After Hurricane Rita, we lost a lot of physicians from southeastern Louisiana. One of
the hospitals we work with lost their radiologist. They had to contract out with a
radiology group, remotely. The radiology group waited until the very last minute to
read the mammogram which caused our data to become untimely. Using Tableau, we
discovered that we had a trend of screenings taking much longer, affecting our
timeliness. We approached that hospital and requested that they renegotiate their
contract with the radiology group. We always try to take action based on the results,”
said Jennifer.
Better Analysis Allows Expansion and Exploration
Using Tableau has enabled LBCHP to improve program performance and apply for
funding for other programs. The organization is applying for another grant to screen
for colorectal cancer. “In a pilot study, we found patients with precancerous
indications--Tableau helped us visualize the data,” said Hayden. “When you’re talking
to grantors, you need to show results and you need to show them in an easy-tounderstand, visually enticing way.”
LBCHP also uses the software to allow people throughout their organization find
answers. “We use the software to explore. For people who don’t have the SQL skills
and for groups that don’t have huge resources to spend on a large, specialized IT staff,
it’s been extremely beneficial to be able to explore our data in sophisticated ways
without being sophisticated programmers. You can get started with it very quickly,
very easily, and create visualizations for the data we are familiar, but need to better
understand.”
“You need to show
results and you need
to show them in an
easy-to-understand,
visually enticing
way.”
Jennifer Hayden, IT
Analyst, LBHCP
Copyright 2009 Tableau Software, Incorporated. All rights reserved. Tableau Software, the Tableau Software logo, and Visual Analysis for Databases are either registered
trademarks or trademarks of Tableau Software, Incorporated. Other company or product names may be the trademarks of their respective owners.


