Proceedings of the Twenty-Ninth AAAI Conference on Artificial Intelligence
Towards Cognitive Automation of Data Science
Alain Biem, Maria A. Butrico, Mark D. Feblowitz, Tim Klinger, Yuri Malitsky,
Kenney Ng, Adam Perer, Chandra Reddy, Anton V. Riabov, Horst Samulowitz,
Daby Sow, Gerald Tesauro, Deepak Turaga
{biem,mbutrico,mfeb,tklinger,ymalits,kenney.ng,adam.perer,creddy,riabov,samulowitz,sowdaby,gtesauro,turaga}@us.ibm.com
IBM Research, Yorktown Heights, NY 10598, USA
Abstract
1
A Data Scientist typically performs a number of tedious and
time-consuming steps to derive insight from a raw data set.
The process usually starts with data ingestion, cleaning, and
transformation (e.g. outlier removal, missing value imputation), then proceeds to model building, and finally a presentation of predictions that align with the end-users objectives
and preferences. It is a long, complex, and sometimes artful process requiring substantial time and effort, especially
because of the combinatorial explosion in choices of algorithms (and platforms), their parameters, and their compositions. Tools that can help automate steps in this process have
the potential to accelerate the time-to-delivery of useful results, expand the reach of data science to non-experts, and
offer a more systematic exploration of the available options.
This work presents a step towards this goal.
6
Learning Controller
2
User Interface
Analytics
Repository
7
3
4
Deployed Analytic
External
Knowledge
Planning and
Deployment
5
Deployed Analytic
R, Weka, SPSS, …
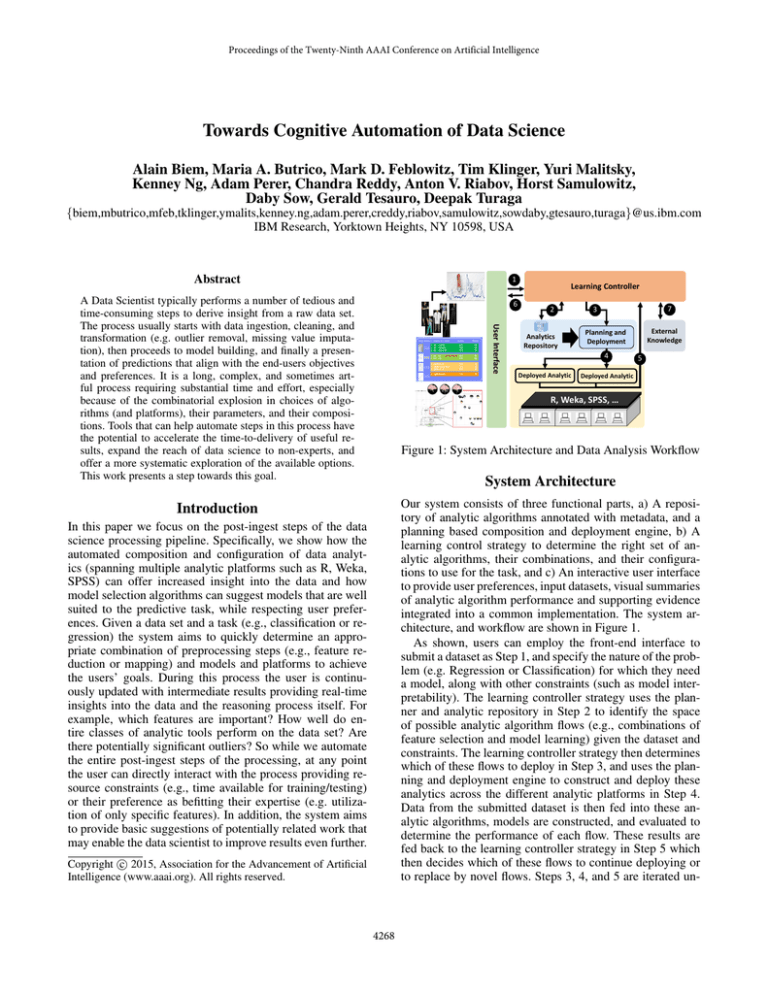
Figure 1: System Architecture and Data Analysis Workflow
System Architecture
Our system consists of three functional parts, a) A repository of analytic algorithms annotated with metadata, and a
planning based composition and deployment engine, b) A
learning control strategy to determine the right set of analytic algorithms, their combinations, and their configurations to use for the task, and c) An interactive user interface
to provide user preferences, input datasets, visual summaries
of analytic algorithm performance and supporting evidence
integrated into a common implementation. The system architecture, and workflow are shown in Figure 1.
As shown, users can employ the front-end interface to
submit a dataset as Step 1, and specify the nature of the problem (e.g. Regression or Classification) for which they need
a model, along with other constraints (such as model interpretability). The learning controller strategy uses the planner and analytic repository in Step 2 to identify the space
of possible analytic algorithm flows (e.g., combinations of
feature selection and model learning) given the dataset and
constraints. The learning controller strategy then determines
which of these flows to deploy in Step 3, and uses the planning and deployment engine to construct and deploy these
analytics across the different analytic platforms in Step 4.
Data from the submitted dataset is then fed into these analytic algorithms, models are constructed, and evaluated to
determine the performance of each flow. These results are
fed back to the learning controller strategy in Step 5 which
then decides which of these flows to continue deploying or
to replace by novel flows. Steps 3, 4, and 5 are iterated un-
Introduction
In this paper we focus on the post-ingest steps of the data
science processing pipeline. Specifically, we show how the
automated composition and configuration of data analytics (spanning multiple analytic platforms such as R, Weka,
SPSS) can offer increased insight into the data and how
model selection algorithms can suggest models that are well
suited to the predictive task, while respecting user preferences. Given a data set and a task (e.g., classification or regression) the system aims to quickly determine an appropriate combination of preprocessing steps (e.g., feature reduction or mapping) and models and platforms to achieve
the users’ goals. During this process the user is continuously updated with intermediate results providing real-time
insights into the data and the reasoning process itself. For
example, which features are important? How well do entire classes of analytic tools perform on the data set? Are
there potentially significant outliers? So while we automate
the entire post-ingest steps of the processing, at any point
the user can directly interact with the process providing resource constraints (e.g., time available for training/testing)
or their preference as befitting their expertise (e.g. utilization of only specific features). In addition, the system aims
to provide basic suggestions of potentially related work that
may enable the data scientist to improve results even further.
c 2015, Association for the Advancement of Artificial
Copyright Intelligence (www.aaai.org). All rights reserved.
4268
additional data will affect the learning process. While the
achieved performance based on subsets of the data is often
inferior to the performance possible when training on the
entire data set, one can establish a ranking of all considered
analytic tools based on this subset, and efficiently explore
their different behaviours. The controller also includes methods (e.g., model-based approaches) to identify analytic flows
with novel parameter settings using various hyper-parameter
exploration strategies independently.
The controller also tries to leverage publicly available textual knowledge to inform the data analysis process. This information could be deep analysis from published scholarly
articles, general information from Wikipedia and manuals,
or practical tips and tricks in various internet forums by various practitioners. Data scientists can harness this knowledge
by asking simple questions - such as ”What is a good regression algorithm to use when there are more features than
number of examples?”. Answering such questions may require techniques ranging from Deep Question /Answering
methods to simple methods such as key-word search and
then ranking based on source-weighted hit frequency. For
now we employ the latter simple approach.
User Interface: The visualization component of the system
builds on INFUSE (Krause, Perer, and Bertini 2014), allowing data scientists a real-time view and control of all the decisions made autonomously by the controller. This means
that at any time, the user can modify the selected analytic
algorithm flow (including feature selection and model building) according to their expertise, while the system takes care
of everything else. The user interface therefore includes the
display of the accuracy and prediction performance achieved
by the top performing analytic flows, as well as a clear presentation of the contributions of the input features to the
classification prediction error achieved by the models. The
system also includes multiple views of the underlying processes, including a Feature View for analyzing the features
according to their rank, and a Classifier View that shows
quality scores of each model.
til a desired end state is achieved. Visual representations of
the results are continuously communicated via the user interface to the end user as part of Step 6. While this allows a
user to understand the choices of features and models made
by the system, it also grants the ability to directly interact
with the process dynamically. For instance, a user can indicate that he/she likes a specific analytic platform, but is wondering if its current performance can be further improved by
the system (e.g., by altering its parameters). Step 7 indicates
that the learning controller also aims to leverage knowledge
from the machine learning community as a whole to make
informed decision in deploying analytics.
Key Contributions: Core Components
We now describe the functional components in more detail.
Planning and Deployment Engine: The engine is implemented using the MARIO system (Bouillet et al. 2008), and
includes a goal-driven planner that finds alternative analytic
flows matching a pre-specified goal. The planning domain
for MARIO is created based on semantic descriptions of analytics and composition patterns expressed by associating
sets of tags (keywords) with inputs and outputs of components. The planner performs two main functions: the discovery of available analytic flows for analyzing data within
specified constraints, and the ranges and types of parameters those analytic flows require. The planner also performs
the deployment of analytics on different platforms, including Weka, SPSS and R, with the help of platform-specific
code generation plug-ins. The plug-ins are also responsible
for compiling the generating code if necessary, and deploying and executing the code on target platforms.
The domain knowledge for MARIO, which includes the
descriptions of analytics and composition patterns, is created and managed with the help of an analytics repository,
SOFIA. The SOFIA repository provides end-user interfaces
for adding new analytics and for defining composition patterns, and supports both domain-independent and domainspecific analytics, and patterns provided to MARIO encoded
in Cascade (Ranganathan, Riabov, and Udrea 2009).
Learning Controller: This component integrates all information that spans from the analytic tool performance, user
preferences, and external knowledge, using a learning-based
approach in order to orchestrate the analysis workflow. The
learning approach supports interactive exploration of the
available analytic flows on a given data set by estimating the
performance of the flows (e.g., prediction accuracy) while
only considering subsets of the given data. In this way, the
most suitable final analytic flow can be identified quickly by
only allocating samples of the data in an iterative manner.
We view this as a multi-armed bandit problem and adopt the
principle of optimism under uncertainty.
This approach allows us to present the user with continuously updated performance estimates (at each iteration) of
all considered analytic tools. For example, while training a
SVM on a data set with millions of data points can often
take days, our approach allocates samples of the data in each
iteration in order to efficiently determine a performance estimate. By directing the planning and deployment engine on
the reduced subset, the controller can get a sense of how
Summary
We integrate learning, planning and composition, and orchestration techniques to automatically and efficiently build
models. This is done by deploying analytic flows to interactively support data scientists in their tasks. In the future we
aim at employing more NLP techniques and additional aspects like introspection and inference as discussed in (Samulowitz, Sabharwal, and Reddy 2014).
References
Bouillet, E.; Feblowitz, M.; Liu, Z.; Ranganathan, A.; and Riabov,
A. 2008. A tag-based approach for the design and composition of
information processing applications. In OOPSLA, 585–602.
Krause, J.; Perer, A.; and Bertini, E. 2014. Infuse: Interactive
feature selection for predictive modelling of high dimensional data.
In IEEE VAST.
Ranganathan, A.; Riabov, A.; and Udrea, O. 2009. Mashup-based
information retrieval for domain experts. In CIKM, 711–720.
Samulowitz, H.; Sabharwal, A.; and Reddy, C. 2014. Cognitive
automation of data science. In ICML AutoML Workshop.
4269

