Computational Physiology — Papers from the AAAI 2011 Spring Symposium (SS-11-04)
Real-Time Extraction and Analysis of Key Morphological Features in the
Electrocardiogram, for Data Compression and Clinical Decision Support
Ankit J. Gordhandas and Thomas Heldt and George C. Verghese
Computational Physiology and Clinical Inference Group
Research Laboratory of Electronics
Massachusetts Institute of Technology
Cambridge, MA
the amount of memory available for data storage. Similarly,
power constraints prevent continuous wireless transmission
of the raw data, even over short distances. To provide clinicians with intermittent updates on patient health, and to mitigate the data storage limitations, it seems imperative that
data be reduced on chip by extracting clinically meaningful
information from the volumes of data collected.
Here, we present a real-time ECG processing algorithm
that “compresses” the raw data by identifying and retaining clinically relevant landmarks of the ECG on a beat-bybeat basis. The retained landmarks are the kinds of variables a clinician uses to interpret the ECG, such as the width
and height of the QRS complex or the elevation of the STsegment. Furthermore, the algorithm keeps a running average of each landmark and triggers an alarm whenever significant changes are detected. When such an event is triggered,
the algorithm automatically stores the raw ECG data from
five beats preceding to five beats following the anomaly, for
the benefit of review by a clinician. While our data compression algorithm is inherently lossy, a cartoon-type ECG
beat can be reconstructed that conveyes most of the relevant
information on which clinical decisions are based.
Abstract
Massive amounts of clinical data can now be collected
by stand-alone or wearable monitors over extended periods of time. One key challenge is to convert the volumes of raw data into clinically relevant and actionable
information, ideally in real-time. This becomes imperative especially in the domain of wearable monitors,
where power and memory constraints prevent continuous communication of raw, uncompressed data to a
base station for a health care provider. We focus here on
algorithmic approaches to extract clinically meaningful
information from the electrocardiogram (ECG) in realtime.
We use a curve-length transform to identify, and aggregate from beat to beat, physiologically relevant timing
information, such as the onsets and offsets of P-waves,
QRS complexes, and T-waves, along with their respective magnitudes. Each heartbeat is thus parametrized in
terms of 12 variables. Assuming a nominal heart-rate of
70 beats per minute, and a sampling frequency of 250
Hz, each beat has approximately 215 samples. Reducing each beat to 12 samples thus gives an 18-fold compression.
An exponentially-weighted sliding average of the identified morphological features over the preceding twenty
beats is also stored. Whenever any feature deviates significantly from its stored weighted average, the algorithm registers an alarm and also retains the raw ECG
data of the 5 beats immediately preceding and following the anomalous occurrence, for a later review by a
clinician.
Methods
Feature-onset and offset detection
ECG analysis typically starts with beat-onset detection, by
locating the QRS complexes. We follow the work by Zong
et al. and use the curve-length transform to detect the onset and offset of QRS complexes (Zong, Moody, and Jiang
2003). The method relies on the fact that in most standard
projections the ECG curve length corresponding to the QRS
complex is generally larger than that of other segments of
the ECG.
For a continuous differentiable function x(t), the curve
length L at time t over the time interval w is given by
t t
dx
ds =
(1 + )2 dt
L(t) =
dt
t−w
t−w
Introduction
A long-term ECG (or Holter) recording allows physicians
to analyze a patient’s cardiac rhythm over extended periods (typically 24 hours) and to quantify the frequency and
severity of cardiac conduction problems that may manifest
irregularly or only over short durations. Advances in hardware development have led to progressive miniaturization of
such wearable ECG monitors (Fensli, Gunnarson, and Gundersen 2005). Similarly, advances in power management allow these devices to collect data for longer periods of time
(Park et al. 2006). The reduction in size, however, limits
The discrete-time version of this equation can be written as
c 2011, Association for the Advancement of Artificial
Copyright Intelligence (www.aaai.org). All rights reserved.
L[i] =
i
Δt2 + Δx2k
k=i−w
15
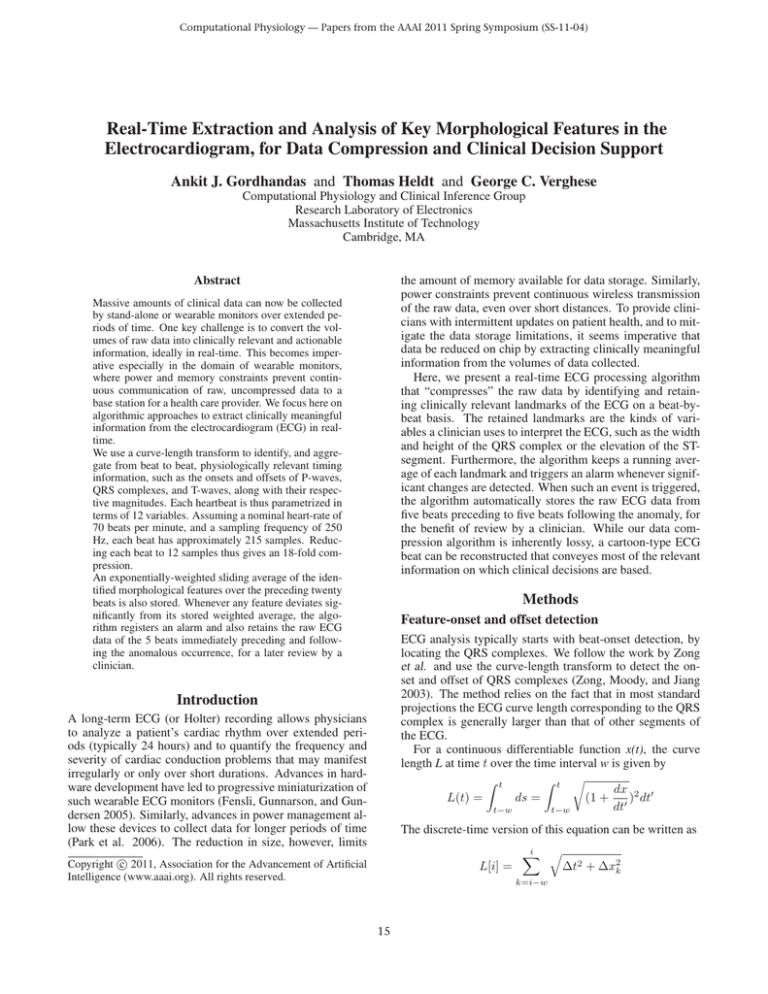
Figure 1: ECG signal (bottom) and its length transform
(top).
where Δxk = xk − xk−1 .
For QRS detection, the window length w was chosen to
be 130 ms, which represents an upper limit for the duration
of the QRS complex. Figure 1 shows a segment of an ECG
signal along with the computed length transform. As is evident, the rising edge of the length transform corresponds to
the onset of the QRS complex.
Whenever the length transform crosses a pre-defined (but
adaptive) threshold, the time-point of threshold-crossing is
noted. The algorithm then searches backward for 100 ms to
determine the minimum value, LTmin , of the length transform forward for 150 ms to determine the maximum value,
LTmax . Subsequently, the algorithm tracks backward from
the point of threshold-crossing until the value of the length
−LTmin )
). This point
transform drops to (LTmin + (LTmax100
is noted as the onset of the QRS complex. The point where
+LTmin )
) is
the length transform rises to (LTmin + (LTmax100
noted as the end of the QRS complex (Zong, Moody, and
Jiang 2003).
The first fifteen beats of each records are used as a training
period to determine the threshold. To account for baseline
wandering, the algorithm uses adaptive thresholding. Initially, the threshold value is assigned as 2.5 times the average value of the length transform during the training period.
The threshold is then adjusted, based on the maximum value
of the length transform of each detected feature (see Zong
et. al. for details). Within each QRS complex, we identify
the location and magnitude of the R-wave.
The curve-length transform outlined above was modified
to aid in feature extraction. The P-wave duration is typically
less than 110 ms, and the PR-interval ranges from 110 ms
to 200 ms. The algorithm backtracks from t0 , the location
of the R-wave, and computes the length transform over a
window w = 110 ms from t = to − 200 ms to to − 90 ms.
The T-wave lasts for 100 ms to 250 ms, and the QT-interval
is typically around 400 ms. To identify the onset and end of
the T-wave, we compute the length transform over a window
w = 250 ms from t = to + 320 ms to t = to + 450 ms.
Figure 2 shows an ECG segment along with the results of
our detection algorithm. The beginnings and the ends of the
P-waves, the QRS complexes and the T-waves are respectively marked with an ‘x’, a ‘+’ sign, and a circle, respec-
Figure 2: ECG signal with the onsets and ends marked for
the P-waves (x), the QRS complexes (+), and the T-waves
(o).
tively.
Data reduction
After detection of the P-waves, QRS complexes, and Twaves, the algorithm calculates the following variables:
1. P-wave duration
2. Height of P-wave
3. PQ height
4. PR-interval
5. QRS width
6. QR height
7. RS height
8. QT-interval
9. ST-segment elevation
10. T-wave height
11. T-wave duration
12. RR interval
These quantities along with the raw signal for each beat,
are stored for five beats after which the raw signal is overwritten.
Assuming a nominal heart-rate of 70 beats per minute and
a sampling rate of 250 Hz, each beat comprises roughly 216
samples. Reducing each beat to 12 features thus results in
an 18-fold compression, though note that the ECG signal so
parameterized cannot be reconstructed.
Irregularity detection
An important component of the algorithm is deciding when
to raise an alarm. A running exponential average of each
feature is maintained using
Ax [n] = k · x[n] + (1 − k) · Ax [n − 1]
16
100
90
T−Wave Offset
QRS Offset
P−wave Offset
80
Matching Annotations (%)
70
60
50
40
30
20
10
0
1
2
3
4
5
Δn
Figure 3: Cartoon of the 12 parameters captured.
Figure 5: Cumulative distribution of matching annotations
as a function of Δn.
database was created by compiling 105 records from different, existing PhysioNet ECG databases. Within each record,
30 to 100 representative beats were annotated by cardiologists, who identified the beginning and end of the P-waves,
the beginning and end of QRS-complexes, and the end of the
T-waves. All records were recorded at a sampling frequency
of 250Hz.
The 15 records in the QT-Database which were derived
from the MIT-BIH Arrhythmia Database were used to test
the irregularity-detection feature of our algorithm. There
were a total of 77 manually annotated occurrences of arrhythmia.
Figure 4: Detection of an abnormal feature as determined by
our algorithm. The arrow indicates the abnormality.
Results
The algorithm described above was prototyped in MATLAB
and then tested on a Texas Instruments MSP430 microprocessor. For each record, data was stored on the EEPROM of
the microprocessor and then fed to the algorithm sample-bysample, to simulate a real-time processing environment.
where Ax is the weighted average of the corresponding
physiological landmark x. In our application, we set the parameter k to 0.8. The average stored in this manner ensures
that recent values are weighted more than past values. The
deviation, Dx [n], of each feature from its average is computed according to
Feature detection
|x[n] − Ax [n]|
Ax [n]
Whenever the deviation crosses the threshold of 0.75, an
alarm is raised. In that case, the compression of the ECG
signal is stopped and the five beats preceding and following
the flagged beat are stored in their raw form. Such an occurrence is illustrated in Figure 4. As such, the compression of
the electrocardiogram lags by five beats.
Dx [n] =
Figure 5 shows the cumulative distribution of matching annotations as a function of Δn, the difference in sample numbers between the manual annotations and those derived by
our algorithm.
Irregularity detection
Of the 77 manually annotated arrhythmias, the algorithm
detected 76. Alarms were also raised for 3 instances that
were not marked as incidences of arrhythmias. The method
thus displayed a sensitivity of 98.70% and a specificity of
96.10%.
Test data
We used the PhysioNet QT-Database to test our algorithm
(Goldberger et al. 2000 June 13; Laguna et al. 1997). This
17
Discussion
References
The current trend in wearable ECG monitoring technology point to declining form factors and extended monitoring durations. The reduction in size of such devices is often achieved by sacrificing on-board memory. Additionally,
increasing power constraints typically prevent the wireless
streaming of ECG data sample-by-sample. Algorithmic approaches are therefore required to turn the acquired physiological data into actionable physiological information. The
algorithm presented above complements the current trends
in wearable ECG hardware design in that it extracts and
tracks clinically important and interpretable landmarks of
the ECG waveform, thus only requiring the storage of 12
landmarks as a function of time. By providing an approximate 18-fold compression, it is ensured that memory is not a
limiting factor as far as the recording duration is concerned.
Furthermore, the wireless communication of such a small
set of variables is eminently feasible. However, it might not
be necessary to transmit the values of these landmarks every
beat but only when significant deviations from past values
are detected.
Additionally, the detection of irregularities, raising of
alarms, and appropriately halting compression ensures that
when close inspection of the raw data is possible when it
might be clinically indicated. The sensitivity and specificity
of the irregularity-detection algorithm are very promising,
though these statistics were obtained only for a relatively
small number of arrhythmic events.
Andrews, C.; Davies, J.; and Schwarz, G. 1971. Adaptive
data compression. IEEE Proceedings 55:123–162.
Deepu, C. J.; Xu, X. Y.; Zou, X. D.; Yao, L. B.; and Lian,
Y. 2010. An ECG-on-chip for wearable cardiac monitoring
devices. In Proceedings of IEEE International Symposium
on Electronic Design, Test and Application, 225–228.
Fensli, R.; Gunnarson, E.; and Gundersen, T. 2005. A wearable ECG-recording system for continuous arrhythmia monitoring in a wire-less tele-home-care situation. In Proceedings of the IEEE International Symposium on ComputerBased Medical Systems (CBMS), 407–412.
Goldberger, A. L.; Amaral, L. A. N.; Glass, L.; Hausdorff,
J. M.; Ivanov, P. C.; Mark, R. G.; Mietus, J. E.; Moody,
G. B.; Peng, C.-K.; and Stanley, H. E. 2000 (June 13). PhysioBank, PhysioToolkit, and PhysioNet: Components of a
new research resource for complex physiologic signals. Circulation 101(23):e215–e220. Circulation Electronic Pages:
http://circ.ahajournals.org/cgi/content/full/101/23/e215.
Jalaleddine, S. M. S.; Hutchens, C. G.; Strattan, R. D.; and
Coberly, W. A. 1990. ECG data compression techniques-a
unified approach. IEEE Transactions on Biomedical Engineering 37:329–343.
Kwong, J., and Chandrakasan, A. 2010. An energy-efficient
biomedical signal processing platform. In Proceedings of
IEEE European Solid-State Circuits Conference, 526–529.
Laguna, P.; Mark, R.; Goldberger, A.; and Moody, G. 1997.
A database for evaluation of algorithms for measurement of
QT and other waveform intervals in the ECG. Computers in
Cardiology 24:673–676.
Okada, M. 1979. A digital filter for the QRS complex detection. IEEE Transactions on Biomedical Engineering BME26:700–704.
Pahlm, O., and Sornmo, L. 1984. Software QRS detection
in ambulatory monitoring : A review. Med. Biol. Eng. Comp
22:289–297.
Park, C.; Chou, P. H.; Bai, Y.; Matthews, R.; and Hibbs, A.
2006. An ultra-wearable, wireless, low power ECG monitoring system. In Proceedings of IEEE BioCAS.
Syed, Z.; Scirica, B.; Stultz, C.; and Guttag, J. 2009. Electrocardiographic prediction of arrhythmias. Computing in
Cardiology 36:565–567.
Zong, W.; Moody, G.; and Jiang, D. 2003. A robust opensource algorithm to detect onset and duration of QRS complexes. Computers in Cardiology 30:737–740.
Future Work
The work outlined here is an initial step towards achieving on-chip ECG data reduction while retaining and tracking physiologically important variables over time. While
our initial results are very promising, further validation is
necessary, especially on data derived from Holter monitors. We also aim to incorporate information from a 3axis accelerometer, possibly feeding into the determination
of thresholds, in order to avoid raising unnecessary alarms
during periods of significant activity when signal-to-noise
might be low.
Acknowledgements
The authors thank Dr. Faisal Kashif and Mr. Bryan
Haslam for spirited discussion and valuable suggestions to
the project. They are also grateful to Dr. Dennis Buss of
Texas Instruments and Prof. Anantha Chandrakasan of MIT
for their interest and support. This work was supported in
part by Texas Instruments, Inc.
18


