SIMON FRASER UNIVERSITY Department of Economics Econ 435 Prof. Kasa
advertisement
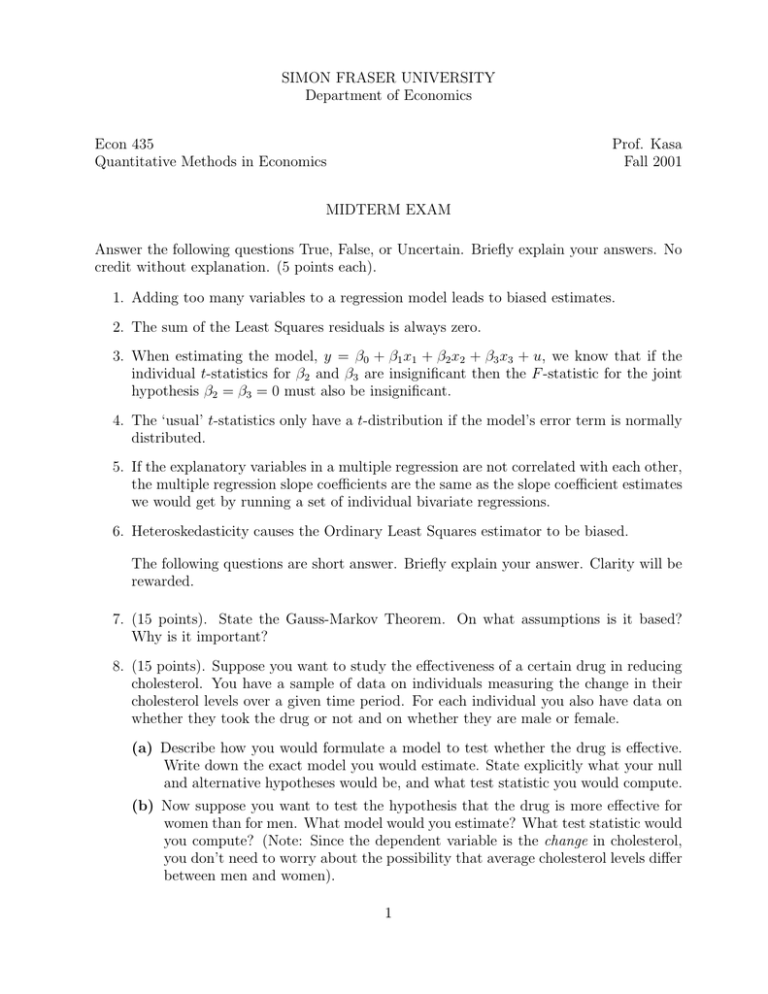
SIMON FRASER UNIVERSITY Department of Economics Econ 435 Quantitative Methods in Economics Prof. Kasa Fall 2001 MIDTERM EXAM Answer the following questions True, False, or Uncertain. Briefly explain your answers. No credit without explanation. (5 points each). 1. Adding too many variables to a regression model leads to biased estimates. 2. The sum of the Least Squares residuals is always zero. 3. When estimating the model, y = β0 + β1 x1 + β2 x2 + β3 x3 + u, we know that if the individual t-statistics for β2 and β3 are insignificant then the F -statistic for the joint hypothesis β2 = β3 = 0 must also be insignificant. 4. The ‘usual’ t-statistics only have a t-distribution if the model’s error term is normally distributed. 5. If the explanatory variables in a multiple regression are not correlated with each other, the multiple regression slope coefficients are the same as the slope coefficient estimates we would get by running a set of individual bivariate regressions. 6. Heteroskedasticity causes the Ordinary Least Squares estimator to be biased. The following questions are short answer. Briefly explain your answer. Clarity will be rewarded. 7. (15 points). State the Gauss-Markov Theorem. On what assumptions is it based? Why is it important? 8. (15 points). Suppose you want to study the effectiveness of a certain drug in reducing cholesterol. You have a sample of data on individuals measuring the change in their cholesterol levels over a given time period. For each individual you also have data on whether they took the drug or not and on whether they are male or female. (a) Describe how you would formulate a model to test whether the drug is effective. Write down the exact model you would estimate. State explicitly what your null and alternative hypotheses would be, and what test statistic you would compute. (b) Now suppose you want to test the hypothesis that the drug is more effective for women than for men. What model would you estimate? What test statistic would you compute? (Note: Since the dependent variable is the change in cholesterol, you don’t need to worry about the possibility that average cholesterol levels differ between men and women). 1 9. (15 points). Suppose you have cross-sectional survey data on 17 households, which includes information for a given year on each household’s annual expenditures on food, it’s annual family income, and the number of children living at home. You are interested in studying the relationship between food expenditure and income. To do this you regress the log of food expenditure on the log of family income and the number of children. You get the following results: log(F OOD) = 20.2 + 0.827 log(IN COM E) + 0.251CHILDREN Standard errors are in parentheses. Are these results consistent with the hypothesis that the income elasticity of food expenditure is one? Assume that you are only willing to tolerate a 5% chance of incorrectly rejecting the null hypothesis. 10. (15 points). Briefly describe two tests for heteroskedasticity. How do you compute them? What is their (asymptotic) distribution? Explain the intuition behind them. 11. (10 points). Your friend has correctly pointed out that correlation between a model’s error term and the explanatory variables causes Least Squares to produce biased estimates. She then proposes the following strategy to test for the presence of such correlation. First, estimate the original equation, and then regress the residuals on the X variables in order to see if there is a significant relationship. Briefly comment on this strategy. Do you see any potential problems with this approach? 2
