SHAW Survey (2009) Findings
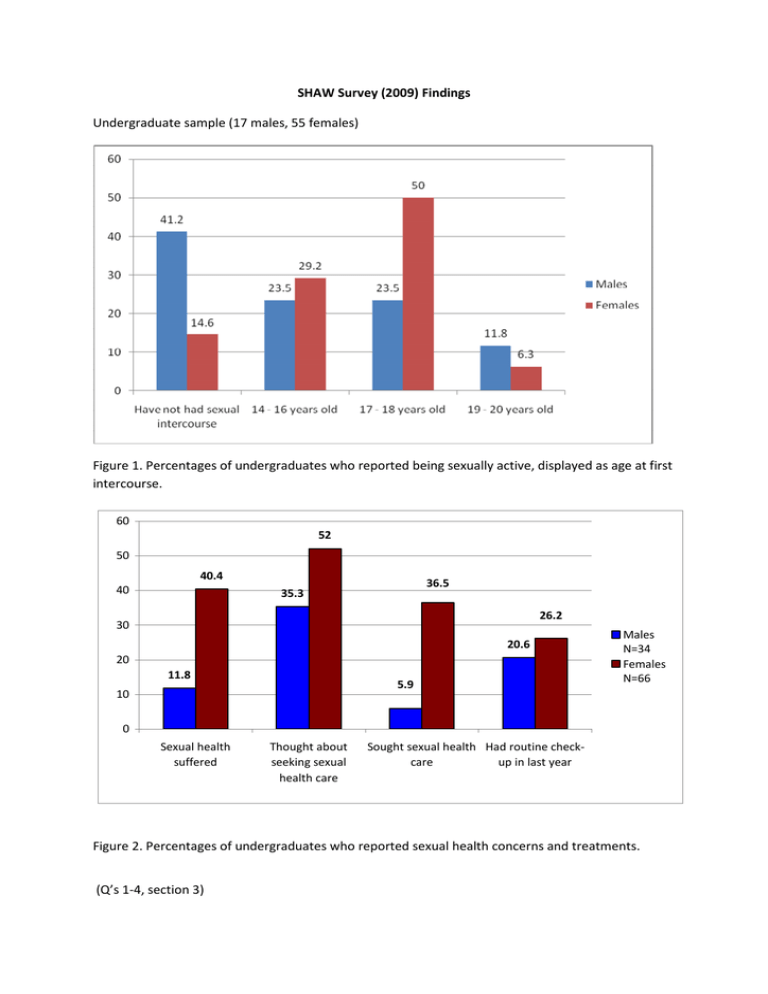
Undergraduate sample (17 males, 55 females)
Figure 1. Percentages of undergraduates who reported being sexually active, displayed as age at first
intercourse.
60
52
50
40.4
40
36.5
35.3
26.2
30
20.6
20
11.8
5.9
10
Males
N=34
Females
N=66
0
Sexual health
suffered
Thought about
seeking sexual
health care
Sought sexual health Had routine checkcare
up in last year
Figure 2. Percentages of undergraduates who reported sexual health concerns and treatments.
(Q’s 1-4, section 3)
Figure 3. Percentages of undergraduates who report having had casual sex partners in their lifetime.
Figure 4. Reported proportional condom use in undergraduates.
Figure 5. Method of birth control for male and female undergraduates.
Figure 6. Concern regarding HIV/AIDS and STD. Students were significantly more worried about STD than
either HIV or AIDS, p=.000 for both.
70
63.6
58.8
60
50
40
Males
30
20
Females
18.2
17.6
11.8
10.6
11.8
10
7.6
0
Have never had a
partner
1 - 3 partners lifetime
4 - 5 partners lifetime
6+ partners lifetime
Fi
gure 7. Percentages of students who have had 0, 1-3, 4-5, or 6+ boy/girlfriends over their lifetime.
Sex partners over lifetime
42.5
45
40
35.5
35
30
25
20
22.6
22.5
24.3
19.4
16.7
Females
16.5
15
10
5
0
Have not had intecourse
1 -2 sex partners
3 -4 sex partners
Males
5 or more sex partners
Figure 9. Number of sex partners over lifetime in terms of percentages of students.
Sex partners in past 3 months
80
68.2
70
55.9
60
50
40
Males
29.4
Females
30
20
16.7
2.9 12.1
10
5.9
5.9
1.5
1.5
0
0 partners
1 partner
2 partners
3 partners
4 or more partners
Figure 10. Percentages of students who have 0 to 4 or more sex partner is the past 3 months
Condom use for most recent intercourse
65
70
60
60
50
40
35
40
Males
30
Females
20
10
0
Used a condom
Did not use a condom
Figure 11. Percentage of male and female students who used a condom for their most recent intercourse.
Condom usage over lifetime
45
38.9
40
35
27.3
30
25
Males
20
Females
15
10
5
4.5
2.9
0
9.1
0
None of the time
Some of the time
Half of the time
Most of the time
All of the time
Figure 12. Percentages of students who report using condoms none, some, half, most, or all of the time
during intercourse.
Only 3 students reported not using any birth control method. The rest use condoms or the pill.
2 males and 2 females report ever being told they have an STD
Percentages of students who answered the following questions correctly
Q: Vaseline can be used with condoms and they will work just as well (false)
91.8
94
92
90
88
86
84
Males
82.4
Females
82
80
78
76
Q: If a man pulls out before he ejaculates, it is still possible for the woman to get
pregnant. (true)
96
93.4
94
92
90
88
86
84
82
80
85.3
Males
Females
Q: It is only important to put a condom on right before ejaculation to avoid
pregnancy (false)
100.5
100
100
99.5
99
98.5
Males
98.3
Females
98
97.5
97
Q: The most likely time for a woman to get pregnant is right before her period starts.
(false)
67.8
67.7
67.7
67.6
67.5
67.4
67.3
67.2
67.1
67
66.9
67.2
Males
Females
Q: When putting a condom on, it is important to have it fit tightly, leaving no space
at the tip (false)
84
83.1
83
82
81
80
Males
79.4
Females
79
78
77
Q: It is impossible to get a sexually transmitted infection if you only engage in oral
sex. (false)
90.32
90.3
90.3
90.28
90.26
90.24
90.22
90.2
90.18
90.16
90.14
Males
90.2
Females
Percentage liklihood of intercourse over the next year
80
72
70
55.9
60
50
Males
40
Females
30
20
10
16.1 18
9.7
1.6
9.7
4.9
3.2
3.3
0
Sure it won't
happen
Probably won't
happen
Even chance (50%)
it will happen
Probably will
happen
Will happen for
sure
Figure 13. Students’ reports of how likely they are to engage in intercourse over the coming year.
Figure 14. How sure are you that you would be able to do the following, if you thought that you
wanted to?
Use a condom correctly
80
66.7
70
65.6
60
50
Males N=34
40
30
20
10
16.7
16.7
0
26.2
Females N=66
6.6
1.6
0
very unsure
somewhat unsure
somewhat sure
very sure
Tell a partner what you will or won't do sexually
80
68.8
72.1
70
60
50
Males N=34
40
21.9
30
20
10
Females N=66
21.3
9.4
0
1.6
4.9
0
very unsure
somewhat unsure
somewhat sure
very sure
Say no to sex if a partner refused to use a condom
90
78.7
80
66.7
70
60
Males N=34
50
40
30
20
10
Females N=66
16.7
0
3.3
6.7
11.5
6.6
0
very unsure
somewhat unsure
somewhat sure
very sure
Convince a new partner to use a condom
90
77
80
70
59.4
60
50
Males N=34
34.4
40
Females N=66
30
16.4
20
10
3.1
4.9
3.1
1.6
0
very unsure
somewhat unsure
somewhat sure
very sure
Refuse to engage in sex with someone who was pressuring you
90
78.7
80
65.6
70
60
Males N=34
50
40
25
Females N=66
30
20
10
0
3.3
9.4
13.1
4.9
0
very unsure
somewhat unsure
somewhat sure
very sure
Resist friends' pressure to make you have sex with someone
85.2
90
75
80
70
60
Males N=34
50
40
Females N=66
18.8
30
20
10
3.1
4.9
3.1
3.3
6.6
0
very unsure
somewhat unsure
somewhat sure
very sure
Delay having sex with someone you really care about and find attractive
46.9
50
42.6
45
39.3
40
35
30
20
15
Females N=66
13.1
12.5
10
Males N=34
18.8
21.9
25
4.9
5
0
very unsure
somewhat unsure
somewhat sure
very sure
Resist pressure from friends to drink more alcohol than you intended
50
40.6
45
40
34.4
35
45.9
34.4
30
Males N=34
25
20
15
10
14.8
15.6
Females N=66
9.4
4.9
5
0
very unsure
somewhat unsure
somewhat sure
very sure
Sexual orientation Qs
When you think about sexual fantasies you have had, which sex have they been?
70
60
50
64.5
45
41.7
Males N=31
40
30
19.4
20
9.7
10
Females N=60
6.5
8.3
0
0
Exclusively opposite
sex
Most often
opposite sex,
sometimes same
sex
Equally opposite
and same sex
Most often same
sex, sometimes
opposite sex
Exclusively same
sex
When you think about persons you have been sexually attracted to, which sex have
they been?
70
62.5 62.3
60
50
Males N=32
40
30
21.9
26.2
Females N=60
9.4
20
10
6.3
1.6
0
Exclusively
opposite sex
Most often Equally opposite
opposite sex, and same sex
sometimes
same sex
3.3
Most often
same sex,
sometimes
opposite sex
0
4.9
0
1.6
Exclusively same Not applicable
sex
When you think about the persons you have had sex with, which sex have they
been?
80
70
60
50
40
30
20
10
0
73.8
62.5
Males N=31
6.6
Exclusively
opposite sex
3.1
0
Most often Equally opposite
opposite sex, and same sex
sometimes
same sex
3.1 1.6
Most often
same sex,
sometimes
opposite sex
4.9
13.1
Females N=60
Exclusively same not applicable
sex
When you think about the persons you have been in love with, which sex have they
been?
90
80
70
60
50
40
30
20
10
0
81.3
75.4
Males N=32
6.3 6.6
Exclusively
opposite sex
0
1.6
Most often Equally opposite
opposite sex, and same sex
sometimes
same sex
0
0
Most often
same sex,
sometimes
opposite sex
3.1 6.6
9.4 9.8
Exclusively same not applicable
sex
Females N=61
14
12
11.8%
10.6%
10
Males N=34
8
6
Females N=66
4
1 person
2
1 person
0
Lack of sexual fantasy
Disturbed by lack of fantasy
Figure 15. Percentage of students who report having a lack of sexual fantasy.
15.2%
16
14
11.8%
12
10
Males N=34
8
6
Females N=66
4
2
0
Experience sexual aversion
Figure 16. Percentage of students who report an aversion to sexual contact with a partner.
33.3
35
30
25
19.7
20
10
11.8
12.1
15
5.9
8.8
5
0
Problems with
lubrication/erection
Problems reaching orgasm
Genital pain
Figure 17. Percentage of students who report some form of sexual dysfunction.
Only two women report never having had an orgasm.
Males N=32
Females N=61


