COMMENTARY
advertisement

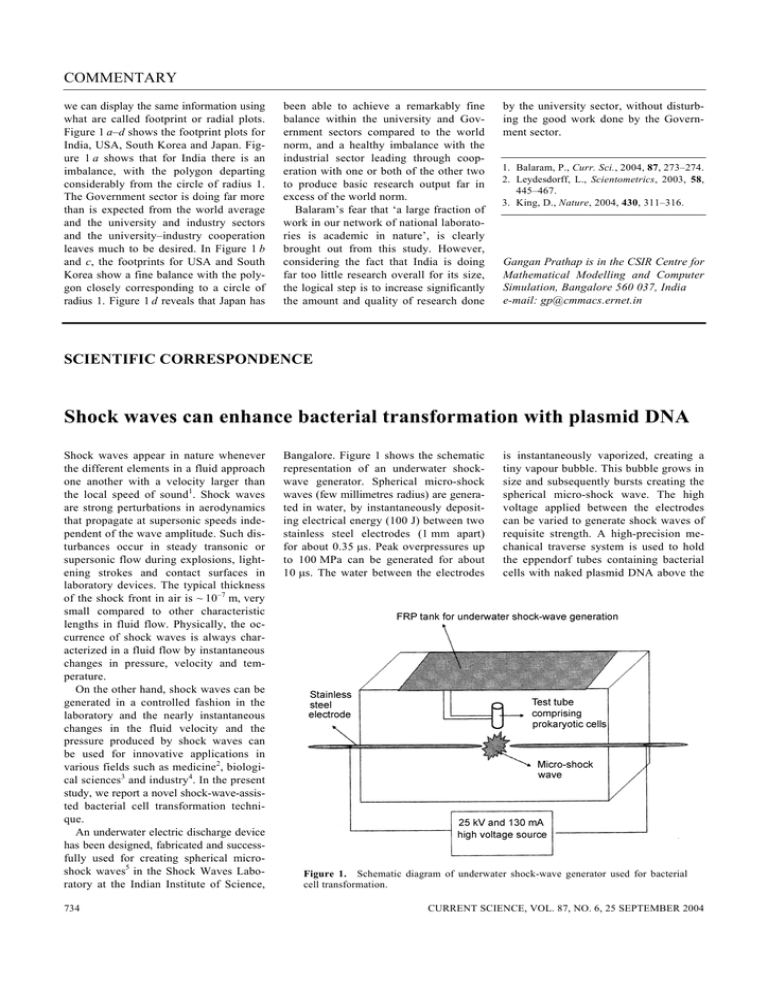
COMMENTARY we can display the same information using what are called footprint or radial plots. Figure 1 a–d shows the footprint plots for India, USA, South Korea and Japan. Figure 1 a shows that for India there is an imbalance, with the polygon departing considerably from the circle of radius 1. The Government sector is doing far more than is expected from the world average and the university and industry sectors and the university–industry cooperation leaves much to be desired. In Figure 1 b and c, the footprints for USA and South Korea show a fine balance with the polygon closely corresponding to a circle of radius 1. Figure 1 d reveals that Japan has been able to achieve a remarkably fine balance within the university and Government sectors compared to the world norm, and a healthy imbalance with the industrial sector leading through cooperation with one or both of the other two to produce basic research output far in excess of the world norm. Balaram’s fear that ‘a large fraction of work in our network of national laboratories is academic in nature’, is clearly brought out from this study. However, considering the fact that India is doing far too little research overall for its size, the logical step is to increase significantly the amount and quality of research done by the university sector, without disturbing the good work done by the Government sector. 1. Balaram, P., Curr. Sci., 2004, 87, 273–274. 2. Leydesdorff, L., Scientometrics, 2003, 58, 445–467. 3. King, D., Nature, 2004, 430, 311–316. Gangan Prathap is in the CSIR Centre for Mathematical Modelling and Computer Simulation, Bangalore 560 037, India e-mail: gp@cmmacs.ernet.in SCIENTIFIC CORRESPONDENCE Shock waves can enhance bacterial transformation with plasmid DNA Shock waves appear in nature whenever the different elements in a fluid approach one another with a velocity larger than the local speed of sound1. Shock waves are strong perturbations in aerodynamics that propagate at supersonic speeds independent of the wave amplitude. Such disturbances occur in steady transonic or supersonic flow during explosions, lightening strokes and contact surfaces in laboratory devices. The typical thickness of the shock front in air is ~ 10–7 m, very small compared to other characteristic lengths in fluid flow. Physically, the occurrence of shock waves is always characterized in a fluid flow by instantaneous changes in pressure, velocity and temperature. On the other hand, shock waves can be generated in a controlled fashion in the laboratory and the nearly instantaneous changes in the fluid velocity and the pressure produced by shock waves can be used for innovative applications in various fields such as medicine2, biological sciences3 and industry4. In the present study, we report a novel shock-wave-assisted bacterial cell transformation technique. An underwater electric discharge device has been designed, fabricated and successfully used for creating spherical microshock waves5 in the Shock Waves Laboratory at the Indian Institute of Science, 734 Bangalore. Figure 1 shows the schematic representation of an underwater shockwave generator. Spherical micro-shock waves (few millimetres radius) are generated in water, by instantaneously depositing electrical energy (100 J) between two stainless steel electrodes (1 mm apart) for about 0.35 µs. Peak overpressures up to 100 MPa can be generated for about 10 µs. The water between the electrodes is instantaneously vaporized, creating a tiny vapour bubble. This bubble grows in size and subsequently bursts creating the spherical micro-shock wave. The high voltage applied between the electrodes can be varied to generate shock waves of requisite strength. A high-precision mechanical traverse system is used to hold the eppendorf tubes containing bacterial cells with naked plasmid DNA above the Figure 1. Schematic diagram of underwater shock-wave generator used for bacterial cell transformation. CURRENT SCIENCE, VOL. 87, NO. 6, 25 SEPTEMBER 2004 SCIENTIFIC CORRESPONDENCE electrodes. The distance between the bottom of the tube and electrodes can be accurately adjusted (least count 0.01 mm) and monitored using a digital encoder. In most of the current experiments, the distance between the test tube and the electrodes was maintained at ~ 3 mm and the corresponding pressure measured (PVDF Needle Hydrophone, Ms Muller, Germany) inside the test tube was ~ 130 bar. To examine the feasibility of using shock waves in bacterial cell transformation, we used Escherichia coli (DH5alpha) competent cells. The fresh overnight-grown cultures of E. coli (DH5-α) were inoculated to 100 ml LB and allowed to grow at 37°C for 3–4 h till OD600 reached 0.4–0.5. Then the culture was cooled in ice (for 15 min) and centrifuged at 3000 rpm for 7 min at 4°C. The pellet was dissolved in 10 ml of transformation-storage buffer (TSB, PEG400010%, DMSO 5%, MgCl2 10 mM, MgSO4 10 mM, Glycerol 10 v/v, LB 6.1 pH) and centrifuged at 3000 rpm for 7 min at 4°C. The resulting pellet was resuspended in 5 ml of TSB. The resuspended cells were stored in 100 µl aliquots at –70°C after freezing in liquid N2 and used for transformation. The transformation was done using 10 ng of naked plasmid DNA (pBI121 containing nptII and gus genes, Clontech, USA). About 50–100 µl competent cells were mixed with plasmid DNA and exposed to shock waves. After exposure to shock waves, the cells were grown in a medium devoid of antibiotic for 1 h at 37°C, before transferring to an antibiotic (kanamycin 50 µg/ml) selection. The efficiency of transformation was compared with the KCM method of bacterial transformation, which was found to be efficient under normal laboratory conditions6. For the KCM method, competent cells (50–100 µl) were mixed with plasmid DNA (10 ng) and KCM buffer (5 × buffer – 500 mM KCl, 150 mM CaCl2, 250 mM MgCl2). The cells were then incubated in ice for 20 min before keeping at room temperature for 10 min. After incubation, the cells were grown and selected as mentioned above. The isolated colonies were counted to express the transformation efficiency as CFU/µg of plasmid DNA. We have successfully demonstrated the usefulness of shock waves in bacterial cell transformation. The spherical micro- shock waves generated by the underwater shock-wave generator enhanced the uptake of naked DNA by the prokaryotic cells. Pressure levels beyond 150 bar resulted in a few colonies. Therefore, the experiments were carried out with overpressure levels less than 130 bar. We compared the transformation efficiency of the shock-wave method with the KCM method using competent E. coli cells prepared by a common protocol. There was an increase in the efficiency of transformation in shock-wave-exposed cells (Figure 2). In our experiments, we did not observe any significant transformation event in E. coli competent cells mixed with naked plasmid DNA in the absence of shock-wave application. We confirmed the transformation event by Figure 2. Transformation efficiency (expressed as CFU/µg of plasmid DNA) of Escherichia coli (DH5-alpha) cells. 1, KCM method and 2, Shock-wave-assisted transformation method. 1 2 3 4 5 10,000 bp isolating the plasmids7 from the transformed cells and subjecting the plasmids to restriction digestion (Figure 3) and polymerase chain reaction to amplify the gene of interest (data not shown). It appears that the exposure of shock waves temporally enhances the cellmembrane permeability, thereby enabling the transformation. We have noticed transformation event even in non-competent cells, but further study is underway to confirm the process. However, more experiments are mandatory to clearly understand the actual mechanism of celltransformation enhancement after exposure to shock waves. In any case the technique evolved in this study holds a lot of promise for introduction of different macromolecules, including DNA into different cell types. 1. Griffth, W. C., J. Fluid Mech., 1981, 106, 81–101. 2. Delius, M., Shock Waves, 1994, 4, 55–72. 3. Jagadeesh, G. and Takayama, K., J. Indian Inst. Sci., 2002, 82, 49–57. 4. Takayama, K., Jagadeesh, G. and Shibasaki, S., Japanese Patent Number 3445982, June 2003. 5. Jagadeesh, G., Onodera, O., Ogawa, T., Takayama, K. and Jiang, Z., AIAA J., 2001, 39, 424–430. 6. Walhout, A. J. M., Temple, G. F., Brasch, M. A., Hartley, J. L., Lorson, M. A., van den Heuvel, S. and Vidal, M., Methods Enzymol., 2000, 328, 575–580. 7. Sambrook, J., Fritsch, E. F. and Maniatis, T., Molecular Cloning: A Laboratory Manual, Cold Spring Harbor Laboratory Press, Cold Spring Harbor, NY, 1989, 2nd edn. Received 3 June 2004; revised accepted 26 August 2004 3000 bp 2000 bp G. JAGADEESH1,* K. N. NATARAJA2 M. UDAYAKUMAR2 1 Figure 3. Detection of transformed DNA on agarose gel electrophoresis. Lane 1, Generuler 1 kb ladder (MBI, Fermentas); lanes 2 and 4, Purified plasmid from transformed cells; lanes, 3 and 5, Plasmid digested with EcoRI and HindIII respectively. Plasmids in lanes 2–5 were isolated from cells obtained by KCM and shock-wave method of transformation respectively. CURRENT SCIENCE, VOL. 87, NO. 6, 25 SEPTEMBER 2004 Department of Aerospace Engineering, Indian Institute of Science, Bangalore 560 012, India 2 Department of Crop Physiology, University of Agricultural Sciences, GKVK Campus, Bangalore 560 065, India *For correspondence. e-mail: jaggie@aero.iisc.ernet.in 735


