From: AAAI Technical Report SS-02-08. Compilation copyright © 2002, AAAI (www.aaai.org). All rights reserved.
Semantic Extents of Sketches
Atsushi Shimojima and Daisuke Motohashi
School of Knowledge Science
Japan Advanced Institute of Science and Technology
1-1 Asahi-dai, Tatsunokuchi, Nomi-gun
Ishikawa 923-1292, Japan
{ashimoji, d-motoha}@jasit.ac.jp
Abstract
This paper investigates how an interpreter resolves a
particular type of ambiguities common in sketches,
namely, the ambiguities as to what graphical variables
(such as line width in sketched maps) are expressive
and what are not. We hypothesize that a graphical variable is assessed to be non-expressive if it has a unified
value throughout the sketch (e.g. all bands representing
roads have the same width in the sketch). Our experiment, which analyzed interpretative decisions of human
subjects on sketches, has in fact demonstrates such an
unfiedness effect, although an interesting collection of
exceptions were also found. We discuss the implications of these results, and offer the interpretation of the
unfiedness effect as an evidence to the veristic disambiguation strategy.
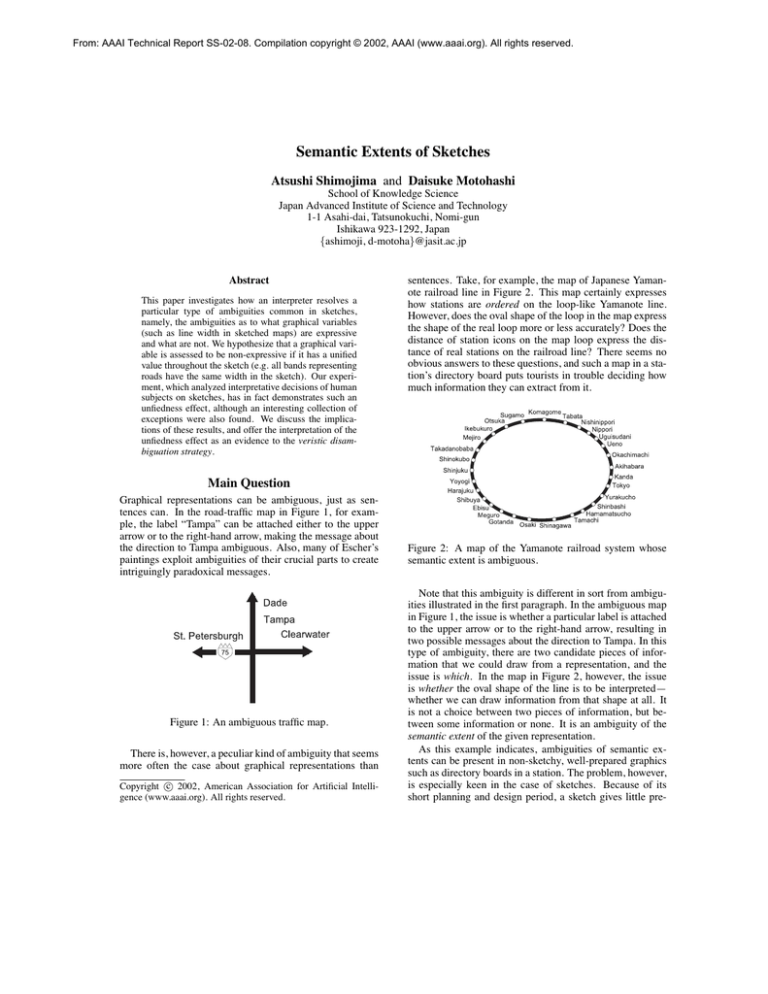
sentences. Take, for example, the map of Japanese Yamanote railroad line in Figure 2. This map certainly expresses
how stations are ordered on the loop-like Yamanote line.
However, does the oval shape of the loop in the map express
the shape of the real loop more or less accurately? Does the
distance of station icons on the map loop express the distance of real stations on the railroad line? There seems no
obvious answers to these questions, and such a map in a station’s directory board puts tourists in trouble deciding how
much information they can extract from it.
Main Question
Graphical representations can be ambiguous, just as sentences can. In the road-traffic map in Figure 1, for example, the label “Tampa” can be attached either to the upper
arrow or to the right-hand arrow, making the message about
the direction to Tampa ambiguous. Also, many of Escher’s
paintings exploit ambiguities of their crucial parts to create
intriguingly paradoxical messages.
Figure 1: An ambiguous traffic map.
There is, however, a peculiar kind of ambiguity that seems
more often the case about graphical representations than
c 2002, American Association for Artificial IntelliCopyright gence (www.aaai.org). All rights reserved.
Figure 2: A map of the Yamanote railroad system whose
semantic extent is ambiguous.
Note that this ambiguity is different in sort from ambiguities illustrated in the first paragraph. In the ambiguous map
in Figure 1, the issue is whether a particular label is attached
to the upper arrow or to the right-hand arrow, resulting in
two possible messages about the direction to Tampa. In this
type of ambiguity, there are two candidate pieces of information that we could draw from a representation, and the
issue is which. In the map in Figure 2, however, the issue
is whether the oval shape of the line is to be interpreted—
whether we can draw information from that shape at all. It
is not a choice between two pieces of information, but between some information or none. It is an ambiguity of the
semantic extent of the given representation.
As this example indicates, ambiguities of semantic extents can be present in non-sketchy, well-prepared graphics
such as directory boards in a station. The problem, however,
is especially keen in the case of sketches. Because of its
short planning and design period, a sketch gives little pre-
contextual cue for an interpreter to infer plausible semantic
rules associated with it. Moreover, there is often little consistency in a drawer’s choice of particular semantic rules for
his or her sketch. This makes the semantic system associated with sketches largely unpredictable, generating an issue
of semantic extents almost unexceptionally.
The main question in our research is, then, how people
resolve the issue of semantic extents in their everyday use
of sketches. The relevance of this question to the design
of a sketch understanding system is obvious. Human interpreters manage to use sketches in communication, so knowledge about their interpretative strategies (such as the use of
contextual or structural cues for disambiguation) is at least
helpful for a sketch understanding system. But it is not only
helpful, but essential for such a system, since such interpretative strategies used by interpreters are often presupposed
by sketch drawers. Thus, it is a part of the commonground
(Clark 1996) that must be shared by any participant in sketch
communication, humans or not.
Related Work
Disambiguation strategies for semantic extents of sketches
have been largely an unexplored field. In cognitive psychology, sketches were often studied in connection with
architectural design (Goel 1995; Suwa & Tversky 1997;
Suwa, Gero, & Purcell 1998), where the main issue was the
effects of sketch drawing on the internal cognitive processes
of architects, rather than semantic properties of sketches.
With a slightly different focus, Tversky and Lee (1999) studied syntactic and semantic commonalities of route maps that
subjects promptly produced on the request for a direction to
a nearby shop. Their study, however, has an emphasis on
a surprising systematicity of such sketches, as opposed to
ambiguities in them.
More directly concerned with the informational contents of sketches was Stahovich (1998), who clarified how
sketches in mechanical engineering exploit geometrical constraints on graphics to convey rich information about the
working of the depicted devises. Although the study captured an important semantic function of sketches, the issue
of their semantic ambiguities were outside its scope.
Logic has a recent tradition of applying its modeltheoretic method to specify the semantics of graphical representations (e.g., Shin 1994), yet it is only to capture a fixed
semantic system, rather than the way a drawer and an interpreter come to share it. Healey (1997) conducted interesting
experiments to capture this dynamic process, but the focus
was on creations of semantic conventions for graphical notations, rather than disambiguation processes for conventional
graphical notations. Neilson and Lee (1994) qualitatively
analyzed a spoken dialogue involving sketched floor plans,
and offered certain generalizations about the way spoken
language and sketches disambiguate each other. However,
ambiguities discussed in this work were ones between multiple messages, rather than ambiguities of semantic extents
as defined above.
Pilot Experiment
Our approach to the issue is experimental, involving human
subjects actually drawing sketches or interpreting them. No
doubt, there are various disambiguation strategies for semantic extents of sketches, such as references to the purpose
of sketching, knowledge of sketch drawers, and accompanying gestures and speech. As a starter, however, we are
currently interested in the disambiguation strategies without
these contextual resources. What strategies do interpreters
appeal to, given only the structures of sketches per se, with
minimal contextual information?
We start with a brief report of our pilot experiment directed toward this issue.
Methods
The experiment had two stages. In the first stage, we asked
six male subjects (ages: 22–26) to produce hand-drawn
route maps of their home towns. Each subject was instructed
to draw a route from a particular landmark to another landmark within a 30-minute walking distance. The subject was
then asked to fill in a questionnaire about the semantic extents of his map. It consisted of the following questions:
1. Does the width of a line or band in your map reflect the real
width of the road it represents?
2. Does the shape of a line or band in your map reflect the shape of
the road it represents?
3. Does a distance between map elements reflect the real distance
of the represented objects (e.g. buildings, crossings)?
4. Does the spatial arrangement of map elements reflect the real
arrangement of the represented objects?
In the second stage, we showed four of the maps to six
other male students. (Two maps were not used because they
were too rough and almost incomprehensible.) None of the
subjects were familiar with the towns drawn in the stimulus
maps. The subjects were then given a questionnaire, with
questions essentially same as 1–4 above.
Results
We list two main tendencies found in our data.
Conservativity. The subjects in the first stage (mapdrawers) tend to answer positively to the questionnaire: all
four questions were answered positively for two maps, and
three questions were answered positively for one map. That
is, the drawers generally put lots of information in their
sketches. In contrast, the subjects in the second stage (interpreters) tend not to draw much information from the
sketched maps. For example, the widths of lines in one
map were interpreted by only one of the four interpreters, although the drawer expressed real widths of roads with those
features; the same happened to the arrangements of map elements in another map, and to the shapes of lines in still
another map. In one map, no interpreters interpreted the distance of map elements, although the drawer put information
in them. The interpreters were conservative: they seem to be
under-interpretative about graphical features of sketches.
Figure 3: A map drawn in the pilot experiment. Bands of
different widths appear.
Unifiedness effect. When a variable in a map (such as line
width, line shape, element distance, and element arrangement) has a constant value, the interpreters seems to have
taken it not to reflect the corresponding variable in the real
region (road width, road shape, object distance, and object
arrangement). For example, bands in the map in Figure 3
have different widths, and three out of four interpreters took
their widths to reflect real widths of the represented roads. In
contrast, bands in the map in Figure 4 have almost the same
width, and only one of four interpreters took it to reflect real
widths.
The map in Figure 5 is an extreme case where all roads are
represented by bands with the same width (just lines!), and
of course, none of our subjects took their width to express
the width of real roads.
Such a unfiedness effect seems also holds for shape. For
example, all lines in the map in Figure 6 are almost straight,
and only one interpreter took them to express real road figures. In contrast, one band in the map in Figure 4 has a bend,
and all four interpreters took band figures to reflect real road
figures. Similar tendencies were observed for element distances and arrangements.
Hypothesis
In this particular study, we focus on the second tendency
found in the pilot experiment, and designed the main experiment to test the existence of such a unfiedness effect. The
hypothesis to be tested is therefore:
Unifiedness Hypothesis Interpreters tend not to interpret a
graphical variable when it has a constant value on the
given graphic; they tend to interpret a graphic variable
when it has varied values.
Figure 4: A map drawn in the pilot experiment. All bands
have almost the same width, but one band has a bend.
Main Experiment
Methods
The experiment consists in presenting computer-generated
maps to subjects and having them judge expressiveness of
different variables in a way similar to the second stage of
the pilot experiment.
Stimuli The maps presented to subjects were prepared in
the following way. We first chose an arbitrary road map depicting a real Japanese region of about 24 acres. We stripped
off all symbols and letters representing landmarks and their
names, leaving only lines and bands representing roads and
rivers. The top-left map in Figure 7 is an example of map
thus constructed. Using a graphic software, we manipulated
graphical variables in this “original” road map in several different ways.
U NIFICATION OF SINGLE VARIABLES . We made constant
the values of exactly one of the following variables: the
width of bands expressing roads, their shape (all made
straight), the angle of their crossings (all made 90 degree),
and the distance between crossings. This operation therefore generates four variants of the original map, called
“singular variants” of the original map. For example, the
top right map in Figure 7 is the singular variant of the map
to its left, after the width variable is unified.
U NIFICATION OF THREE VARIABLES . Rather than unifying single variables, we unified different combinations
of three variables taken from width, distance, angle, and
shape. This operation therefore generates four variants of
the original map, called “triple variants” of the original
map. For example, the bottom left map in Figure 7 is the
triple variant of the original map on its top, after distance,
angle, and path are unified.
Figure 5: A map drawn in the pilot experiment. All roads
are represented by simple lines with the same width.
Figure 6: A map drawn in the pilot experiment. All lines are
almost straight.
U NIFICATION OF FOUR VARIABLES . We unified all the
four variables. The resulting variant is called the quadruple variant of the original. For example, the bottom right
map in Figure 7 is the quadruple variant of the original
map to its top left.
Taking two members from each of the five map groups,
we assigned a total of ten maps to each subject, where the
stimulus sets consisted of one original, four single-variable
variants, four triple-variable variants, and one four-variable
variant.
Note that the stimuli used in this experiment were
computer-manipulated road maps, not hand-drawn sketches.
We preferred computer-manipulation mainly because the
test of the unifiedness hypothesis requires comparisons of
subject judgements on maps that differ systematically in
unifiedness and variedness of their variables. Manipulating variables systematically in hand-drawn maps is much
harder, and even if we succeeded, the resulting maps would
be as artificial as computer-generated maps. Thus, although
the experimental setting itself departs from real-life sketch
communications, it serves better to testing the unfiedness
hypothesis, which, as we have emphasized, has an important ramifications about sketch communications.
Thus, we constructed a total of 9 variants out of a single
original map. In the following, we call the set consisting
of an original map and its nine variants a “map group.” As
variants of the same original map, all members of a map
group share a basic topological structure. We applied the
above operations to five different road maps and produced a
total of 50 different maps, including originals, in five map
groups.
Procedures The maps thus constructed were then used as
stimuli to ten female subjects (ages: 22–31). For each map, a
subject was asked to answer four questions, including questions 1–3 used in the pilot experiment and the following
question:
5. Does the angle made by two intersecting lines or bands in your
map reflect the real angle made by the represented intersecting
roads?
This question asks about expressiveness of an angle made
by crossing lines or bands, while question 4 used in the pilot
experiment mainly involves expressiveness of an arrangement of crossings of lines and bands. We changed the question because the arrangement of crossings heavily depends
on the distance of line crossings, the line width, and the line
shape. Accordingly, subject responses to question 4 may
not be independent from those to questions 1–3. The angle
variable is more independent from these other variables, and
thus we expected that subject responses to 5 would be more
informative as data.
Results
Table 1 shows the distribution of subject judgments of expressiveness and non-expressiveness of variables relative to
how many variables are unified in stimulus maps. It shows a
clear decrease of expressiveness judgements in an inverse
proportion to the number of unified variables, χ2 (3, n =
400) = 56.03, p < .001. That is, subjects judged more
variables as non-expressive as more variables are unified in
stimulus maps.
Table 2 shows that subject judgements of expressiveness
or non-expressiveness of variables in fact depend on their
variedness and unfiedness in given maps, χ2 (1, n = 400) =
82.98, p < .001. Out of 200 cases where the variable in
question was unified, subjects judged it to be non-expressive
in 150 cases, and out of 200 cases where the variable in question was varied, subjects judged it to be expressive in 141.
Figure 7: Top-left: the original of map 2. Top-right: the singular variant of map 2 with unified width. Bottom-left: the triple
variant of map 2 with unified distance, angle, and shape. Bottom-right: the quadruple variant of map 2 with unified width,
distance, angle, and shape.
Table 1: Subject judgements of expressiveness (“exp.”) and
non-expressiveness (“not”) relative to the number of unified
map variables, where “originals” are original road maps with
no variables unified, while “1-variable variants” are results
of unifying one variable in originals, and so on. The standardized residuals are shown in parentheses.
originals
Singular variants
Triple variants
Quadruple variants
total
exp.
30 (2.49)
99 (2.59)
58 (-2.11)
4 (-3.46)
191
not
10 (-2.38)
61 (-2.47)
102 (2.01)
36 (3.30)
209
total
40
160
160
40
400
There were, however, a total of 109 exceptional cases, where
subjects judged unified variables to be expressive (50 cases)
or judged varied variables to be non-expressive (59 cases).
Table 3 shows the distribution of subject judgements broken up into individual variables that were assessed. We
found very strong unfiedness effects in subject judgements
on width (χ2 = 75.44, p < .001) and angle (χ2 =
24.37, p < .001); we observed a weaker, but still strong unfiedness effect in judgements on shape (χ2 = 7.85, p < .01).
The overall unifiedness effect was thus preserved in judgements on these individual variables. The effect, however,
disappeared in judgements on distance (χ2 = 3.24, p >
.05).
Finally, Table 4 shows the data broken up into individual
map groups. (Recall that a map group is the set of ten maps
Table 2: Subject judgements of expressiveness (“exp.”) and
non-expressiveness (“not”) relative to variedness and unifiedness of variables. The standardized residuals are shown
in parentheses.
Varied
Unified
total
exp.
141 (4.66)
50 (-4.66)
191
not
59 (-4.45)
150 (4.45)
209
total
200
200
400
consisting of one original map and its nine variants.) The
unfiedness effect is strongly preserved in each map group
(map 1: χ2 = 11.43, map 2: χ2 = 26.47, map 3: χ2 =
24.37, map 5: χ2 = 18.16, p < .001), except that the effect
is slightly weaker in group 4 (χ2 = 7.37, p < .01).
Discussions
What do these results imply about human-human or humanmachine communications using sketches?
Unifiedness effect
First of all, our results show that unifiedness and variedness
of a graphical variable is an important signal of its expressiveness: a variable with varied values is to be interpreted,
while a variable with unified values is not. Interpreters use
this signaling relation routinely to resolve ambiguities of semantic extents often encountered in sketches.
Now, unifiedness and variedness of a variable is a global
Table 3: Subject judgements of expressiveness (“exp.”) and non-expressiveness (“not”) relative to variedness and unifiedness
of variables, divided by the variables at issue.
Varied
Unified
total
width
exp. not
43
7
0
50
43
57
distance
exp. not
33
17
19
31
52
48
angle
exp. not
35
15
10
40
45
55
shape
exp. not
30
20
21
29
51
49
total
200
200
400
Table 4: Subject judgements of expressiveness (“exp.”) and non-expressiveness (“not”) relative to variedness and unifiedness
of variables, divided by the groups of maps at issue. Here, the group 1 consists of the original map 1 and its one-variable,
three-variable, and four-variables variants, and so on.
Varied
Unified
total
group 1
exp. not
25
15
10
30
35
46
group 2
exp. not
32
8
9
31
41
39
group 3
exp. not
30
10
8
32
38
42
property of an entire map, in that they refer to the values
taken by the variable throughout the map. For example, the
width variable can be said to be unified in a map only after the widths of all bands in the map are examined. From
this point of view, our results mean that global properties
of sketches always matter, even when the interpretation of
a small part of a map is at issue. For example, suppose we
look at a particular band in a map and try to extract information about the road denoted by the band. Should we interpret
the width of the band as expressing the width of the represented road? Even though the target of interpretation is only
this small part of the sketch, we are forced to consult the
entire map and examine the widths of all the bands. We are
to interpret the width of the band only when all bands have
the same width in the map. In other words, the unifiedness
rule makes global scanning mandatory in interpretative processes of sketches.
Given such a rule in interpretative processes, it is quite
likely that a corresponding rule also holds in presentation
processes. That is, a variable to be interpreted should have
varied values, while a variable not to be interpreted should
have a unified value. Such a rule would in turn force a
drawer to examine the entire map even when he or she is
adding a small element in the map. For example, even
though we are drawing a particular band, we have to consult
the entire sketch drawn so far, and adjust the width of the
band accordingly. In particular, we have to align its width to
the widths of all the pre-drawn bands if its width should not
be interpreted. It would be worth investigating if the unfiedness rule also holds in presentation processes, making global
scanning of sketches mandatory in sketch drawing.
group 4
exp. not
23
17
11
29
34
46
group 5
exp. not
31
9
12
28
43
37
total
200
200
400
mean that the unfiedness rule does not apply to certain variables. Alternatively, this may mean the existence of biasing
influence of some variables upon others. That is, when some
variable X has unified values, it may bias interpretations of
another variable Y toward non-expressiveness even when Y
itself has varied values, and when X has varied values, it
may bias interpretations of Y toward expressiveness even
when Y itself has a unified values. A scrutiny of our data
suggests such a biasing influence from the angle variable to
the shape variable and the distance variable.
Secondly, our results show that different maps have different sensitivities to the unfiedness rule: while subject interpretations for map groups 1, 2, and 3 follow the rule closely,
those for map group 4 do not do so as closely (Table 4). This
indicates that structural properties of a particular map group
can interfere with the unfiedness effect. In map 4 (Figure 8),
for example, there is a big crossing near the center, formed
by long straight bands. Subjectively, this crossing appears
to determine the impression of the entire map. Thus, one
possibility is that interpreters might have judged the expressiveness of a variable by only examining its values in these
salient bands, rather than examining every little band in the
map. This would suggest that values of a variable in a salient
structure in a map can have more weight on expressiveness
judgments than those in non-salient structures.
Of course, our points on biasing influences and salience
effects are still purely speculative, and verifications of these
conjectures would require more thorough empirical investigations than we have done. Despite this limitation, our
results do suggest that detailed investigations into interfering factors to the unifiedness effect will reveal a lot about
interpretative processes of sketches.
Exceptions
Although our results show the existence of the unifiedness
rule, it is clearly not a universal rule.
First, our variable-wise analysis shows that different variables have different sensitivities to the rule: although interpretations of width, shape, and angle follow the rule closely,
interpretations of distance are not as sensitive to the variable’s unfiedness and variedness (Table 3). This may simply
Veristic Disambiguation
What causes the unifiedness effect? A plausible interpretation is to take it as an instance of a more general interpretative strategy that might be called the “veristic disambiguation,” where the semantic extent of a representation is assessed according to the likelihood of what it would mean.
It recommends to assess a variable in a representation to
Figure 8: The original of map 4, where a crossing in the
center is salient.
be non-expressive if it would express something utterly unlikely in case it were assessed to be expressive. Thus, in
the face of a unified variable, the assessment goes like this.
“Well, this map variable has a unified value. So if it is to
reflect the real variable, the real variable must also have a
unified value. But this is unlikely, given the complexity of
the reality (“All these roads can’t have the same widths!”).
Therefore, this map variable cannot reflect the real variable.”
If the unifiedness effect is in fact an instance of such
a veristic strategy, then the effect should be significantly
weakened if interpreters were given prior evidence that the
mapped region may have unified variables (e.g., “This is a
city in the US,” suggesting that all the streets may be pretty
much straight and cross at right angles). In general, whether
unfiedness of a variable in fact constrains interpretations
would depend on what the interpreter believes, or more precisely, what the interpreter and the presenter mutually presuppose (Clark 1996).
Moreover, if this interpretation is correct, interpreters
should avoid interpreting a map variable if it would result
in information that is utterly unlikely for some other reasons
than unifiedness (“A single shop cannot be this big!”). Thus,
the interactions between the semantic extents of sketches
and what the presenter and the interpreter mutually presuppose would be quite extensive in kind. The unfiedness effect revealed in this paper seems to indicate such a prevalent
veristic disambiguation in sketch communications.
Conclusions
We started with characterizing a kind of ambiguities common in sketches, namely, ambiguities as to whether a graphical variable expresses information or not, as opposed to
(usual) ambiguities as to what particular value it takes in the
sketch and what information it expresses accordingly. The
former is an issue of semantic extents of sketches, whereas
the latter is an issue of their semantic contents that can arise
only after the former is settled.
On the basis of the pilot experiment, we hypothesized that
unifiedness of a variable may constrain interpreters’ decisions on semantic extents of sketches. That is, an interpreter
may refrain from interpreting a variable if it has a unified
value throughout the sketch. In the main experiment, we
collected subject judgements on road maps with varied and
unified variables, and found that there in fact were hypothesized effects in the cases of width, shape, and angle of road
icons. We found, however, a significant number of exceptions too, especially in connection to the distance variable.
Finally, we extracted several implications of our results
related to sketch communications in general. First, global
properties of sketches (unfiedness and variedness of a variable in this case) can constrain an interpretation of even a
small part of the sketch. Secondly, there can be interfering
factors to the unfiedness effect, including the salience of a
particular structure in the sketch and the biasing influence
among different variables. And finally, it may be a general
interpretative strategy to avoid an interpretation of a variable
if it would result in an utterly implausible information in
view of the commonground in the present communication,
namely, what the presenter and the interpreter of a sketch
commonly presuppose. Substantiation of these suggestions
will be an important contribution to the understanding of the
reality of sketch communications.
References
Clark, Herbert, H. 1996. Using Language. Cambridge,
UK: Cambridge University Press.
Goel, V. 1995. Sketches of Thought. Cambridge, MA: The
MIT Press.
Healey, P. 1997. Expertise or expert-ese: The emergence
of task-oriented sub-languages. In Shafto, M., and Langley,
P., eds., Proceedings of the Ninteenth Annual Conference of
the Cognitive Science Society, 301–306.
Neilson, I., and Lee, J. 1994. Conversations with graphics:
Implications for the design of natural language/graphics interfaces. International Journal of Human-Computer Studies 40:509–541.
Shin, S.-J. 1994. The logical status of diagrams. Cambridge, UK: Cambridge University Press.
Stahovich, T. F. 1998. Interpreting the engineer’s sketch:
A picture is worth a thousand constraints. In Reasoning
with Diagrammatic Representations: Papers from the 1997
AAAI Fall Symposium, 31–38. Technical Report FS-97-03.
Suwa, M., and Tversky, B. 1997. How do designers shift
their focus of attention in their own sketches? In Reasoning
with Diagrammatic Representations: Papers from the 1997
AAAI Spring Symposium, 102–108. Technical Report FS97-03.
Suwa, M.; Gero, J. S.; and Purcell, T. A. 1998. The roles of
sketches in early conceptual design processes. In Proceedings of the Twentieth Annual Conference of the Cognitive
Science Society, 1043–1048.
Tversky, B., and Lee, P. U. 1999. Pictorial and verbal
tools for conveying routes. In Freska, C., and Mark, D. M.,
eds., Spatial Information Theory: Cognitive and Computational Foundations of Geographic Information Science.
Berlin: Springer. 51–64.


