From: Proceedings of the Twelfth International FLAIRS Conference. Copyright ' 1999, AAAI (www.aaai.org). All rights reserved.
Anytime Diagnosis Using Model-Based Methods for Satellite Diagnostics
Paul Cobb, Eric S. Yager, Ph.D., Charles Jacobus, Ph.D.
Cybernet Systems Corporation
727 Airport Blvd.
Ann Arbor, MI 48108
Abstract
Many satellite anomalies manifest themselves slowly
over time and go undetected until they reach critical and
possibly unrecoverable status. Because modern satellite
systems are relatively reliable, the ground controller must
perform the almost impossible task of attending carefully
over long periods of time to telemetry readouts which
almost always indicate nominal operation, while
maintaining a constant readiness for the onset of failure.
Humans are notoriously poor at that type of task. On the
other hand, intelligent systems have been successfully used
to monitor emerging trends in data streams and have been
used successfully for tireless monitoring of manufacturing
processes, changes in structure configurations, and
deterministic failure patterns.
The problem then becomes to develop an "intelligent"
real-time system for fault detection, diagnosis, and
recovery/resolution of anomalies in satellite telemetry
streams. This Model Based Reasoning Diagnostic Engine
(MBRDE) is aimed at the combination of adaptive and
knowledge-based intelligent methodologies that provides a
satellite diagnostic assistant for incorporation into future
satellite ground stations.
We present a framework for a diagnostic methodology
that combines characteristics of model-based reasoning
with those of anytime algorithms. We illustrate a bottomup modeling method that constructs a hierarchical device
model, and a top-down traversal method that constructs a
tree of potential component diagnoses for a given anomaly
in the device’s observed outputs. These methods combine
to form an innovative framework for providing diagnostic
assistance based on model-based principles given any
amount of processing time.
This work was performed under a Small Business
Innovation Research contract No. F30602-94-C-0089, Air
Force Research Laboratory, Space Vehicles Directorate,
Kirtland AFB, NM.
Introduction
From their inception, intelligent systems have been
applied to the task of automated diagnosis. Diagnostic
expert systems were among the first successes of artificial
intelligence, and played a key role in the development of
the field.
As the devices under diagnosis grew more complex,
diagnostic system programmers could no longer be assured
their a priori knowledge of how the devices might fail
would be complete. It became apparent that expert
systems’ brittleness -- in the case of diagnosis, their
inability to diagnose novel faults -- would limit their
usefulness. In order to diagnose these unpredicted (or
“unknown”) faults, a more generalized diagnostic
approach was needed. This need led to the application of
the model-based reasoning paradigm to the task of
automated device diagnosis.
The complexity of the diagnostic task has increased in
ways beyond the number of components and
interconnections in devices under diagnosis. Intelligent
systems are called upon to provide diagnoses in
applications where time is an increasingly critical
resource, ranging from nuclear plant control to satellite
health and status monitoring.
In such real-time
applications where operators must be notified of detected
anomalies and their probable cause(s) in a timely manner,
model-based diagnostic systems are faced with a tradeoff
between diagnostic speed and detail. Simply put, the more
accurate and detailed the device model, the more time will
be required to reach a diagnostic conclusion.
Noting the similarity between this diagnostic tradeoff
and that with which real-time planning systems must
contend, we have looked to anytime algorithms for
inspiration. This led to the development of a model-based
diagnostic framework that allows a diagnostic system to
produce a diagnostic response at any time, with the
response becoming increasingly accurate as more
processing time is allocated to the diagnostic task.
In satellite health and status monitoring, early
notification is of great importance. Ground station
operators must be apprised as early as possible of satellite
health problems. In such a setting, it is more desirable to
notify the operator of a telemetry anomaly and provide
continuous feedback as the automated diagnostic system
helps to narrow down the cause of the anomaly than to
wait until a complete diagnosis has been formulated to
provide any diagnostic assistance.
Model-Based Diagnosis
While rule-based reasoning and set covering algorithms
can provide quick and accurate diagnoses of complex
systems, they are limited to known failures and generally
cannot respond to unknown conditions. This limitation
greatly reduces their capability in the area of satellite
diagnosis where the systems cannot be brought back into
the lab for repair.
Model-based reasoning systems use a technique which
base their diagnoses on knowledge of the actual system
models and behaviors. This technique allows for the
diagnoses of problems which were unanticipated when the
system was developed. Since as many as fifty percent of
on-board failures are unforeseen, providing the monitoring
agents with the capability to determine the failed
components is critical to the operation of these
satellites[1].
However, model-based systems typically do not provide
anytime diagnoses, since traversing an entire complex
model will require large amounts of compute time. What
this paper will present is a system for model-based
reasoning that allows for the anytime diagnosis of satellite
malfunctions.
Anytime Algorithms
Anytime algorithms were originally implemented to
solve the problem of the limitation of knowledge-based
systems with time consuming algorithms and variable
performance[2]. Anytime algorithms show an increasing
quality of results gradually as computation time increases.
This provides a tradeoff between resource consumption
and output quality[3]. The quality of the diagnosis is
defined by the depth of the analysis or the certainty. Each
of these methods of obtaining quality may be developed in
several different ways. For example, as an anytime
algorithm progresses it may analyze the system in greater
and greater detail. It may drop deeper down into the
system hierarchy as computational time increases,
providing diagnoses in varying steps. Another method to
obtain this faster diagnosis is to use simpler behavioral
models for calculating results at each component of the
total algorithm. The algorithm would then use more
complex behavioral models as more compute time is
provided.
Anytime algorithms are normally defined in two
different methods, interruptible and a defined
computational time[3]. The interruptible method provides
a more up to the second diagnosis, however it is much
more difficult to implement. In this case we decided to
develop an anytime algorithm using the defined
computational time with a hierarchical interface.
Thisallows us to provide for an interruptible style for a
fast, less accurate diagnosis and a more accurate diagnosis
as compute time is made available.
Anytime Diagnosis
Our diagnostic framework can be characterized by its use
of (1) bottom-up modeling resulting in the creation of a
hierarchical model of complex devices under diagnosis
and (2) top-down traversal of the model resulting in the
continuous refinement of diagnoses generated.
Bottom-Up Hierarchical Modeling
Our approach to device modeling emphasizes abstraction
of the device’s components to create a hierarchical model
of the device under diagnosis. This model permits
diagnoses to be produced at multiple levels of detail.
Modeling Primitives. Borrowing from graph theory, the
basic primitives from which our models are constructed
are components and interconnections. In addition, we
have added a telemetry primitive to denote observable
outputs generated by the device under diagnosis.
Initial Representation. Using these primitives, a device
is first modeled at its lowest level of abstraction, or its
greatest amount of detail. After the components and
interconnections are established, the telemetry points are
added which connect observable outputs to their origins in
the device.
Telemetry Origins. The interconnections from which
telemetry values originate are noted and entered into the
device’s database. These interconnections will be used to
build, and also to prune, the diagnostic tree that is created
as the device model is traversed.
Once the
interconnections have been recorded, the telemetry values
are associated with the source components of those
interconnections.
Abstraction. Once the low-level representation has been
established, repeated groupings of components into
successively-larger super-components create models of the
device at higher levels of abstraction.
Telemetry Tracing. As groups of components are
replaced by single components at higher levels in the
hierarchical model, telemetry locations are passed up the
hierarchy. The end result is that for each telemetry value,
a list is established of its source component at every level
of the hierarchical model.
Example, Pt. 1
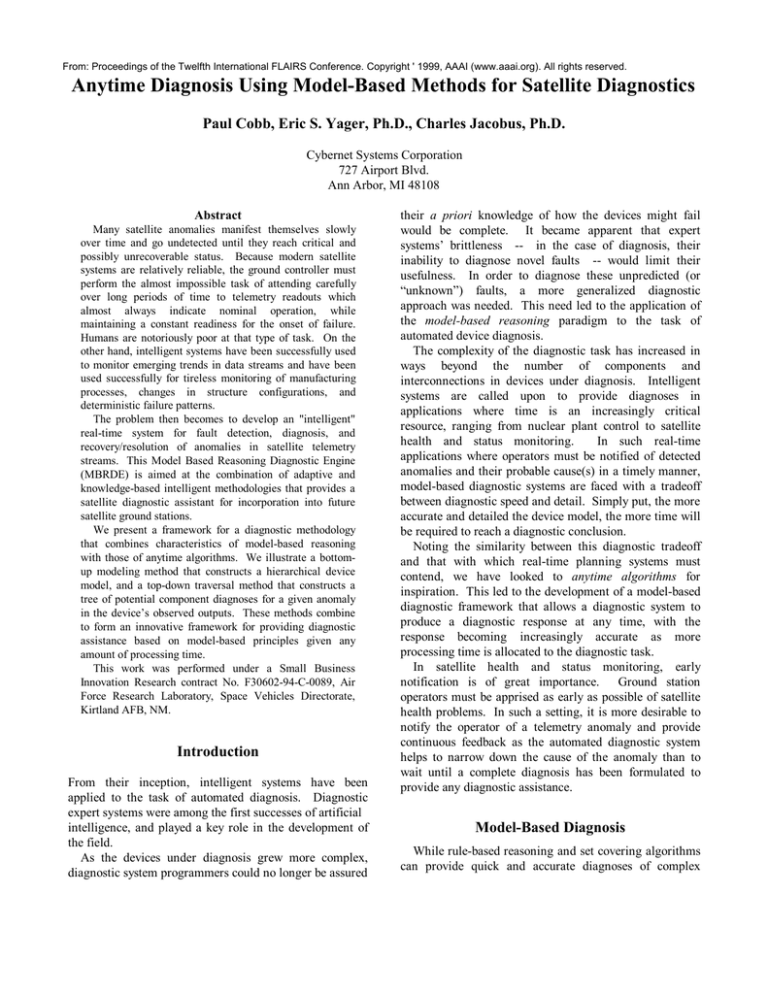
This bottom-up modeling process is illustrated in the
following example. Figure1show the initial representation
of a device. At its level of greatest detail, this device
consists of twelve
Figure 1 show the initial representation of a device. At
its level of greatest detail, this device consists of twelve
(12) components, eighteen (18) interconnections, and five
(5) telemetry points.
From: Proceedings of the Twelfth International FLAIRS Conference. Copyright ' 1999, AAAI (www.aaai.org). All rights reserved.
A
B
C
D
I
TLM1: G
TLM2: H
TLM3: L
TLM4: J
TLM5: B
J
Figure 4: Initial Telemetry Association Lists
E
F
G
H
K
Figure 5 shows the first grouping of the abstraction
process. The components are grouped to create three (3)
super-components consisting of four (4) sub-components
each.
L
A
TLM 1
B
TLM 2
TLM 3
M
TLM 4
TLM 5
C
D
I
J
Figure 1: Initial Representation
O
Figure 2 lists the telemetry origins derived from the initial
representations.
E
(G, TLM1, F)
(H, TLM2, ~)
(L, TLM3, ~)
(J, TLM4, ~)
(B, TLM5, ~)
F
K
L
N
G
H
TLM 1
TLM 2
Figure 2: Telemetry Origins
TLM 3
TLM 4
Figure 3 shows the initial telemetry associations. These
associations link the telemetry values with the components
from which they are output.
A
B
C
D
TLM 5
Figure 5: First Component Grouping
As the abstraction process proceeds, a component
hierarchy is constructed in a bottom-up manner. The
lowest level of this hierarchy is shown in Figure 6.
M
I
A B C D
E
F
G
H
TLM 1
K
N
O
J
L
E
F G H
I
J
K L
Figure 6: Initial Component Hierarchy
TLM 2
TLM 3
TLM 4
TLM 5
Figure 3: Initial Telemetry-Component Associations
Figure 4 enumerates the telemetry associations after the
initial association step.
As this first grouping is made, the telemetry-component
associations are propagated up the hierarchy, such that
each telemetry value is now associated with its source
component at this newly-created level of this hierarchy.
This results of this propagation of associations is depicted
in Figure 7.
Figure 10 gives the final telemetry association lists,
corresponding to the final top-level representation. Each
telemetry value is now associated with its source
component at each level in the model hierarchy.
M
TLM1: G, N, P
TLM2: H, N, P
TLM3: L, O, P
TLM4: J, O, P
TLM5: B, M, P
O
N
Figure 10: Final Telemetry Association Lists
Finally, Figure 11 depicts the final component hierarchy
resulting from the bottom-up modeling process.
TLM 1
TLM 2
TLM 3
P
TLM 4
TLM 5
Figure 7: Second Telemetry-Component Associations
Figure 8 enumerates the resulting telemetry association
lists as they are kept in the device’s description database.
TLM1: G, N
TLM2: H, N
TLM3: L, O
TLM4: J, O
TLM5: B, M
M
A B C D
N
E
F G H
O
I
J
K L
Figure 11: Final Component Hierarchy
Figure 8: Updated Telemetry Association Lists
The first iteration through the bottom-up abstraction
modeling sequence is now complete. This process ceases
when a single-component level has been created as the top
level in the device model, as shown in Figure 9.
Top-Down Diagnostic Refinement
The second half of our anytime diagnostic framework
consists of an algorithm for traversing the model with the
goal of deriving a tree of components making up a list of
potential diagnoses for any given telemetry anomaly. This
model traversal algorithm provides an immediate highlevel list of possible components in which an error could
lead to the telemetry anomaly in question, and also allows
that list of components to be refined continually as time
permits. Key elements of this process follow.
Propagation. The first step in deriving a tree of
components that each represent potential diagnoses is to
propagate a fault marker from the anomalous telemetry
value back through the model. This propagation is
repeated on a sub-component basis as the component tree
is expanded.
P
Replacement. Components in the diagnostic tree are
replaced with their set of sub-components.
TLM 1
TLM 2
TLM 3
TLM 4
Figure 9: Final Representation
TLM 5
Expansion. Sets of sub-components are expanded to form
a more detailed diagnostic tree. The fault markers are
propagated through the set of sub-components to
determine their proper order in the diagnostic tree, which
may result in the insertion of a branch into the tree.
Disconnection. As a set of sub-components is expanded,
an existing branch in the diagnostic tree may no longer
remain connected. As the more detailed propagation takes
place, fault markers will not necessarily be passed to all
paths of a branch. Those branches to which a marker is
not passed will become disconnected from the diagnostic
tree, and will therefore be removed from further
consideration.
In step (g) the fault marker is propagated through group
(I,J,K,L). The group is expanded, and the diagnostic path
connects to component N but not to component M.
Pruning. The diagnostic tree is pruned using nominal
telemetry observations. As fault markers are passed from
component to component along their interconnections, the
propagation ceases when an interconnection has been
noted in the device database as the origin of a telemetry
value and that value has been observed to be within its
nominal operating range.
In step (h), component M and anything that follows it in
the diagnostic path are disconnected, as they could not be
the cause of a telemetry anomaly at TLM3.
(g)
(h)
In step (i) component N is replaced with its subcomponent group (E,F,G,H).
Example, Pt. 2
This top-down process of building a tree of potential
diagnoses is illustrated in the following example, which
uses the device previously modeled.
Given the observation of an anomaly at telemetry value
TLM3 with all others OK, the initial propagation through
the highest level of the hierarchy is shown in steps (a), (b),
and (c). Note that “~” is used to denote a path
termination.
(a)
(b)
(c)
In step (d) component P is replaced with its subcomponent group (O,N,M).
(d)
In step (e) the fault marker is propagated through group
(O,N,M). The group is expanded, and a branch is added
to the diagnostic tree.
(e)
In step (f) component O is replaced with its subcomponent group (I,J,K,L).
(f)
(i)
In step (j) the fault marker is propagated through group
(E,F,G,H). The group is expanded, and a branch is added
to the diagnostic tree.
(j)
Finally the path from component F to component is G is
pruned from the diagnostic tree. Recall from our previous
model-construction example that telemetry value TLM1
originates on the interconnection G F and has
component G as its lowest-level source. Since TLM1 has
been observed to be within its nominal operating range
and no other anomalous telemetry observations have
component G as their origin, fault marker propagation will
not pass from F to G. The final diagnostic tree, consisting
of components that are potential diagnoses for the
observed anomaly at TLM3, is shown as step (k).
Å
Implementation
Originally, the intent of this system was to integrate a
complete diagnosis system into a satellite ground station.
However, because of constraints on the availability of the
data interface, it was determined that using an in house
system would be a more feasible option. In order to
accomplish this task we decided to implement the
diagnostic system a portable power supply on our Portable
Physiological Monitoring System (PPMS). This system
was originally developed for NASA for the physiological
monitoring of astronauts in space. We believe that this
represents the closest available substitute for an actual
satellite system. Also a power supply demonstration using
the PPMS could easily be reconfigured for a satellite
power supply.
This implementation consists of 60 to 80 components,
with 16 to 32 telemetry points read from the system. We
use a PPMS as the telemetry measurement device as well
the device under test. It provides up to 16 channels of A/D
measurements from +/- 10 millivolts up to +/- 5 volts.
The telemetry measurement PPMS taps into the power
module of another unit at some chosen points and provides
this data to the Data Collection and Analysis Environment
(DCAE). This system then ‘checks’ the data and provides
‘Good’ or ‘Bad’ telemetry points into the MBRDE.
This system in itself is a simplistic expert system that
provides the behavioral models for the system components.
It provides the programmable capability to define system
checks via an interactive function generator. Currently,
this system can provides any system check that may be
calculated via a RPN calculator interface. In this case, we
are defining system checks as current and voltage bounds
and behaviors. Simple examples include the limit
checking of currents and voltages in certain states.
Obviously, this computation may have a strong effect
upon the performance of the model-based anytime
algorithm. However, there are qualifications for this expert
system which provide fast, simplistic inputs to the modelbased algorithm without limiting its anytime performance
or capability to provide diagnoses for unknown errors. The
first point describes the simplistic component based model
and the second describes the simple expert system.
The designers of satellite and other complex electronic
systems have very accurate knowledge of the inputs and
outputs of each component. This allows the designer to
easily define a simple set of rules for the inputs and
outputs of each component. This may also be a daunting
task for a large complex system. The MBRDE system
avoids this problem by allowing the designer to focus their
efforts on upper subsystems and those lower subsystems
which are particularly crucial and still provide a
reasonable level of diagnosis. This method allows the
designer to develop his own level of focus on the
components and have the MBRDE system show faults in
only higher subsystems or all the way down to the atomic
component level.
The simple expert system model allows the designer of
the model to quickly develop fault conditions without
writing complex rules for each component. Since the
MBRDE is only interested in the inputs and outputs of the
individual components, the models for each component
may be as simple as a limit check.
The MBRDE system is demonstrated by modifying the
power module to produce known and unknown faults and
use to MBRDE to identify the known faults and determine
the best explanation of unknown faults, which we will
then check.
This system is easily portable for
demonstration. Figure 12 is a diagram of the full MBRDE
system.
Figure 12 MBRDE System Diagram
The following steps trace the path through the diagram
shown in Figure 12.
•
•
•
•
Data taps on the PPMS Power supply send data to the
monitoring PPMS.
The monitoring PPMS unit collects the data from the
power supply taps and sends it to Cybernet’s Data
Collection Broker (DCB).
The DCB then converts the data into a stream format
and stores this information in the Shared Memory of
the Data Interface Library (DIL).
The raw telemetry data is passed through logic
functions in order to create boolean fault data.
•
•
•
•
The boolean telemetry data is sent to the Model Based
Reasoning Diagnostic Engine (MBRDE) which parses
the data.
The GUI sends the model to the MBRDE at any time
during the process..
Once the MBRDE has received both the model and
data, it returns diagnostic information to be displayed
by the GUI.
The raw data can also be sent to the Analysis
application from which it can be viewed by either a
strip chart or text viewer.
The following figure displays the model representation
of the PPMS power supply module.
Figure 14 The Basic Java GUI Interface
Discussion
Figure 13 Depiction of the PPMS Power Supply Module
The early demonstration system used text-based model
coding, which was somewhat arcane. To improve this, a
JAVA-based model GUI was developed. This improved
implementation also includes interfaces to the Common
Object Request Broker Architecture (or CORBA) which
provides an applications independent interface to the
model based reasoning engine. This allows us to easily
integrate the engine into other systems. The interface to
the DCB is through this CORBA interface. The modelbased diagnostics User interface includes on-line help,
model construction, and structured display features. This
GUI allows the model developer to easily design the model
graph for the system. The following figure show a simple
model representation.
We feel the innovation of the methodology presented
here is the combination of model-based diagnostic
methods with characteristics of anytime planing
algorithms. Our diagnostic approach is able to produce a
list of probable diagnoses immediately upon the
recognition of an anomaly in the satellite’s observed
outputs. These diagnoses provide a list of possible failed
components at a high level. From this point on,
computational resources are devoted to elaborating that
diagnostic tree to provide as much detail, or depth, as
possible.
An important distinction between this and other work is
that ours is focused on always having some diagnosis
available for the operator. While the initial level(s) of
diagnosis may at first seem somewhat less-than-useful,
they do serve as general notice to the operator that
something in the device has gone awry and can at least
suggest a general area or set of areas in which the fault(s)
might reside. This allows the monitoring agent to quickly
react to satellite faults which may result in saving the
system from complete loss.
Conclusions and Future Work
This paper presents a significant portion of our work
currently in progress. At this point we have developed a
framework for performing model-based diagnosis that
facilitates the derivation of a list of probable faulty
components, and that derives this list in a continuous
manner so as to always have at least some form of
diagnosis available to the operator at any time.
Using this framework as a foundation upon which to
build, we are currently exploring the integration of finergrained diagnostic tools that will perform resolution
functions given the list of potentially faulty components.
We also intend to pursue methods for easing the
integration of device behaviors into our model. By
developing simpler GUI interfaces for developing the
behavioral models for each of the components a designer
can quickly implement a diagnostic tool that will aid in
development of the systems as well as the monitoring of
the system. This will complement the existing structural
descriptions and provide valuable information to aid in
producing more accurate diagnoses.
References
[1] L. M. Fesq, et al, “ Model-Based Diagnostics For
Space Station Freedom”, In Proceedings of the IEEE 26th
Intersociety
Energy
Conversion
Engineering
Conference(IECEC), Aug. 1991.
[2] M. Boddy and T. Dean, “An Analysis of TimeDependent Planning Problems”, In Proceedings of the
Seventh National Conference on Artificial Intelligence,
1988.
[3] A. Mouaddib abd S. Zilberstein, “Knowledge-Based
Anytime Computation”, In Proceedings of the 14th
International Joint Conference on Artificial Intelligence,
Aug. 1995.
________________
Copyright 1999, American Association for Artificial Intelligence
(www.aaai.org). All rights reserved.
