From: Proceedings of the Twelfth International FLAIRS Conference. Copyright © 1999, AAAI (www.aaai.org). All rights reserved.
RAID: A System to Aid in the Removal of Program Bugs
Lisa Burnell, Alan Meadows,
Patricia Bass, Keith Biggers
John Priest
Mathematics and Computer Science Department
Texas Wesleyan University
Fort Worth, Texas 76105
burnelll@txwes.edu
Industrial and Manufacturing Systems Engineering Department
The University of Texas at Arlington
Arlington, TX 76019
jpriest@uta.edu
Abstract
Debugging is hard. Each program bug brings its own
particular problems, but there are usually three basic steps
that a programmer must perform. These common steps are:
(1) understanding something about the failure and the
program being debugged, (2) finding the error in the
program, and (3) correcting the error. Tools to assist in this
process vary from providing virtually no assistance to
intelligent debugging systems — tools that use knowledge
about programs and program bugs. The purpose of all
intelligent debugging systems is to narrow a software
engineer’s focus to the program statements involved in a
program failure, but existing systems vary in their
efficiency, data requirements, and effectiveness. Using an
approach that combines ideas from existing debugging
systems, we present our work on a probabilistic intelligent
debugging system for high-level languages. This system,
called RAID (Run-time Analysis and Intelligent Debugging
system), is an automated debugger for C programs. It uses
probabilistic reasoning, heuristic debugging knowledge, and
structural analyses to identify the most likely causes of a
program failure.
to begin searching in the program is provided to the
software engineer.
Newer debugging methods use knowledge about the
structure and function of a failed program in order to
reduce the effort required to understand the program and
isolate the error. The reduction in effort is partly achieved
by incorporating some form of slicing and automated
program understanding (see, for example, (Hartman 1992)
and
(Rich, 1981)) to represent and reason with
programming and debugging knowledge. Tools that use
program and debugging knowledge may be called
intelligent debuggers. Two intelligent debuggers are
Spyder (Agrawal, De Millo and Spafford 1993) and
DAACS (Burnell and Horvitz 1995). Since both these
systems use some form of slicing, we briefly review slicing
next.
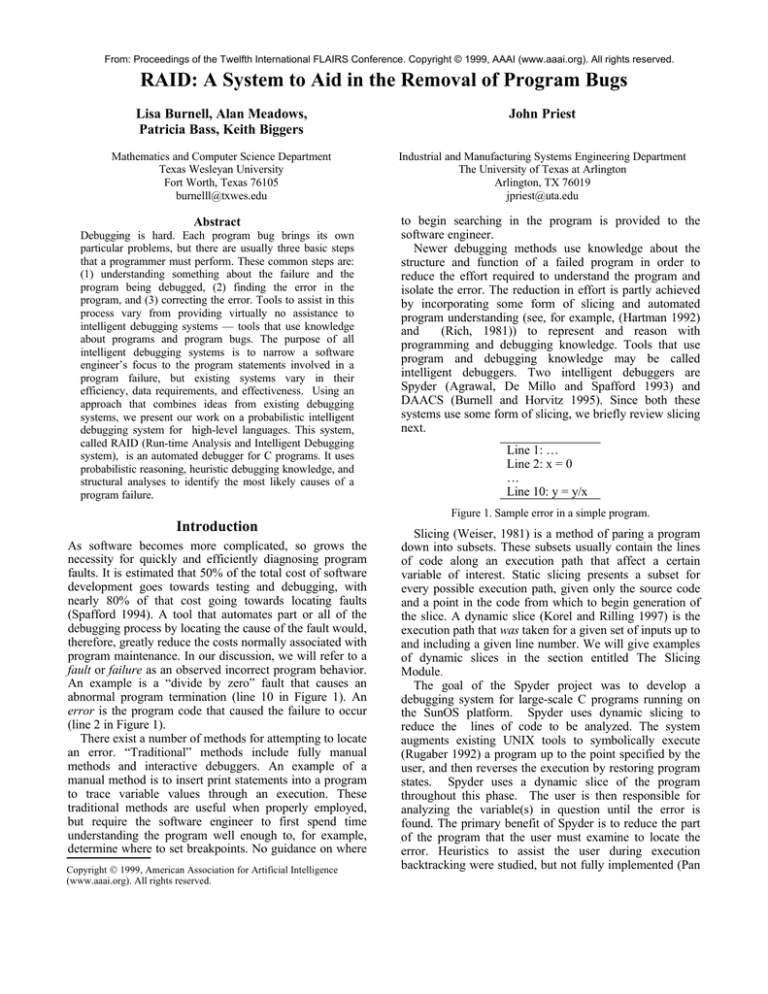
Line 1: …
Line 2: x = 0
…
Line 10: y = y/x
Figure 1. Sample error in a simple program.
Introduction
As software becomes more complicated, so grows the
necessity for quickly and efficiently diagnosing program
faults. It is estimated that 50% of the total cost of software
development goes towards testing and debugging, with
nearly 80% of that cost going towards locating faults
(Spafford 1994). A tool that automates part or all of the
debugging process by locating the cause of the fault would,
therefore, greatly reduce the costs normally associated with
program maintenance. In our discussion, we will refer to a
fault or failure as an observed incorrect program behavior.
An example is a “divide by zero” fault that causes an
abnormal program termination (line 10 in Figure 1). An
error is the program code that caused the failure to occur
(line 2 in Figure 1).
There exist a number of methods for attempting to locate
an error. “Traditional” methods include fully manual
methods and interactive debuggers. An example of a
manual method is to insert print statements into a program
to trace variable values through an execution. These
traditional methods are useful when properly employed,
but require the software engineer to first spend time
understanding the program well enough to, for example,
determine where to set breakpoints. No guidance on where
Copyright 1999, American Association for Artificial Intelligence
(www.aaai.org). All rights reserved.
Slicing (Weiser, 1981) is a method of paring a program
down into subsets. These subsets usually contain the lines
of code along an execution path that affect a certain
variable of interest. Static slicing presents a subset for
every possible execution path, given only the source code
and a point in the code from which to begin generation of
the slice. A dynamic slice (Korel and Rilling 1997) is the
execution path that was taken for a given set of inputs up to
and including a given line number. We will give examples
of dynamic slices in the section entitled The Slicing
Module.
The goal of the Spyder project was to develop a
debugging system for large-scale C programs running on
the SunOS platform. Spyder uses dynamic slicing to
reduce the lines of code to be analyzed. The system
augments existing UNIX tools to symbolically execute
(Rugaber 1992) a program up to the point specified by the
user, and then reverses the execution by restoring program
states. Spyder uses a dynamic slice of the program
throughout this phase. The user is then responsible for
analyzing the variable(s) in question until the error is
found. The primary benefit of Spyder is to reduce the part
of the program that the user must examine to locate the
error. Heuristics to assist the user during execution
backtracking were studied, but not fully implemented (Pan
and Spafford, 1992). Related work has continued in the
χSuds system (Agrawal et al. 1998). The χVue tool, a part
of the χSuds system, uses heuristics to analyze a program
and find errors using the control flow graph, execution
trace and the programmer's knowledge of the program.
The limitation of the χSuds system is that the programmer
must already have enough comprehension of the program
to identify key regions of the code and add tagging
messages in those places.
DAACS is an intelligent error detection system that uses
structural and probabilistic reasoning to diagnose the cause
of abnormal program terminations in assembly language
programs (Burnell and Horvitz 1995). DAACS employs a
hybrid approach to evaluating the program code for errors.
By using static program slicing and limited symbolic
execution to eliminate execution paths from consideration,
DAACS is able to effectively apply probabilistic
reasoning, combined with debugging rules, to the
remaining code in order to identify the most likely cause of
the failure. The primary limitations of the DAACS system
are that it was designed to work only for certain types of
memory errors and only for assembler code. Its basic
architecture, however, appears to be extensible for use with
imperative programming languages, such as C.
Regardless of the debugging tool employed, three major
tasks are usually required. To diagnose errors in a given
piece of software, a debugging system must accomplish the
following:
• Identify the location and type of fault (Pre-Diagnosis)
• Determine the execution path taken in the program
(Slicing)
• Analyze statements on the execution path(s) using
debugging knowledge to determine which statements
caused the failure (Evaluation)
In the following sections, we address these tasks within
the context of the intelligent debugging system we are
currently developing. This system, called RAID, is
presented, followed by a discussion of our plans for
evaluating the utility of RAID. We conclude with a
discussion of future work.
RAID
RAID (Run-time Analysis and Debugging system) is an
automated debugger for the C programming language. It
uses probabilistic reasoning, heuristic debugging
knowledge, and structural analyses to identify the most
likely causes of a program failure. RAID is intended to
assist with the debugging of C programs that have either
abnormally terminated or have produced incorrect output.
The RAID system consists of three major functional
modules: pre-diagnosis, slicing, and evaluation. In
addition, RAID has a database of belief networks that
represents the knowledge necessary to find the cause of
program failures.
The RAID architecture (Figure 2) is based on the
DAACS system. RAID, however, differs in the following
ways:
• Use of dynamic, rather than static, slicing
• Increased scope of fault types analyzed (see Table 1)
• Application of analysis techniques to a high-level
language
• Use of programmer supplied input (such as source
code, failure type and location) in place of a memorydump.
Currently, RAID makes a number of assumptions. First,
we only consider programs in which the failure is caused
by an error internal to the program being analyzed. For
example, failures caused by hard drive crashes can not be
diagnosed by RAID. Second, we make the assumption that
a single program statement caused the failure. The third,
and most stringent assumption, is that the programmer is
required to know enough about the failure to specify the
type and location of the fault. This information is used to
reduce both the size of the program slice and the time
needed for analysis. The Future Work section discusses
our plans to relax these assumptions in future versions.
The Pre-Diagnosis Module
The RAID pre-diagnosis module is responsible for getting
user input necessary for debugging and translating the
program that is to be debugged into a representation that
facilitates finding the cause of the failure. RAID requires
as input (1) the original source code of the program to be
analyzed, (2) the data that was used as input to the failed
program, (3) the line number at which the failure occurred,
and (4) a description of the type of failure that occurred.
The user selects a failure description from a list of
predefined options, a subset of which is shown in Table 1.
For example, say that program X, operating on input file Z,
abnormally terminated execution with a divide by zero
fault at line 10. The user enters the name of the program
“X”, the name of the input file “Z”, and the line number of
the failure (10), and then selects the failure type of “Divide
by 0” from a RAID menu. The requirement for the user to
supply the input data that caused the program failure
allows RAID to generate a dynamic slice. We discuss
relaxation of this requirement in a latter section.
Table 1. A partial list of failure descriptions.
Failure Descriptions
Divide by Zero
Numeric value higher than expected
Numeric value lower than expected
String value unexpected
Time out failure
Array subscript out of range
Output appears corrupted
From: Proceedings of the Twelfth International FLAIRS Conference. Copyright © 1999, AAAI (www.aaai.org). All rights reserved.
RAID Architecture
Failed
Source
Code
e,
typ ,
ure
r
Fail numbe
e
lin t data
u
inp
PreDiagnosis
Module
PDG
Slicer
Module
Slices
Evaluation
Module
Request for
new slice
Debugging
Report
Symbol Table
Belief Nets
Figure 2. RAID Architecture. The diagram of the RAID architecture shows the data flow between modules. The program input is supplied
by the user, who also selects a failure description from a predefined list.
The Slicing Module
The primary purpose of the slicing module is to
immediately reduce the amount of code that will be
evaluated. By taking a dynamic slice of the program, we
can isolate only those statements that were executed for the
input specified.
To build a dynamic slice, it is first necessary to build a
program dependence graph, or PDG (Harrold, Malloy, and
Rothermel, 1993). This graph is a representation of the
program that outlines the control (execution path) and data
(data values) dependencies of each statement. RAID
currently employs a rudimentary dynamic slicing tool.
Future versions will include more advanced methods such
as those found in the Wisconsin Program-Slicer (Reps,
Rosay, and Horwitz, 1997)
The dynamic slice, along with sub-slices on variables of
interest, are then supplied to the evaluation module. By
sub-slice, we mean that portion of the dynamic slice that
involves a given variable. An example of a dynamic slice
(in this case, for a failure description of “numeric value
higher than expected”) is shown in Figure 3, with the subslice on variable x shown in bolded italics.
The slicing module also determines the slice type from a
set of predefined types. For example, the slice type “setbad” indicates that the variable of interest is initialized to a
value and is next used in the failed instruction. In our
example, the slice type for variable x is “setadjust(in_loop)-bad”. The slice types are similar to those
used in the DAACS system, where they were called
syntactic structures (Burnell and Horvitz 1993).
The Evaluation Module
Using the output of the slicing module and the failure
description from the user, the evaluation module begins by
selecting a Bayesian belief network, also known as a belief
net (Pearl, 1988). We have constructed separate belief nets
for each failure description. These belief nets provide two
important functions: (1) to guide a search for the line(s) of
code that caused the failure (the error) and (2) to calculate
the likelihood of alternative hypotheses in the event that
the error can not be determined with certainty. The
problem solving process of the evaluation module is
largely embodied within these belief nets. By using the
belief net to direct a search process, we also have a
mechanism to determine the utility of trying to obtain
further information, a feature that is important for
scaleability.
Void main (void)
{
int x, y, z, w, n, i;
z = 0;
scanf("%d %d", &y, &w);
scanf("%d", &n);
x = y;
if ( y > z) {
for (i = 1; i <=n; i++) {
<…some lines of code omitted…>
x = x * y - w;
<…some lines of code omitted…>
}
}
else {
< the program statements in the else clause are
not executed in this slice. >
}
printf("%d", x); ç user specified failure
}
Figure 3. Sample dynamic slice. The sub-slice on the variable x
shown in bolded italics. The else clause is ommited from the
dynamic slice because this is code that was not executed for the
user-supplied input file.
Specially designated “evidence” nodes in the belief net
are selected for instantiation. Values for these nodes are
determined by executing rules that examine tuples within
the dynamic slice or sub-slice. These rules may also
employ a small theorem prover to perform limited
symbolic execution on the slice. Statements in the slice are
assigned a probability value that represents the likelihood
that the statement is responsible for causing the specified
fault. The assignment of these values takes into account
the slice type, the type of failure, and the other statements
that are contained with the sub-slice.
From: Proceedings of the Twelfth International FLAIRS Conference. Copyright © 1999, AAAI (www.aaai.org). All rights reserved.
Divide by 0
Slice type
P(InitError |set-bad, divide by 0)=0.2
P(InitError |set-adjust-bad,…)=…
P(loop problem|…) = …
…
Error Type (one of:
loop problem,
InitError, etc.)
Loop index
incremented
in loop?
P(set-bad)=0.3
P(set-adjust-bad)=0.2
…
Finding n
Loop termination
value initialized
…
P(Finding=true|Error Type=InitError)= 0.2
…
Figure 4. Belief Net for divide by zero failures. Findings are pieces of evidence collected by the evaluation module. An example finding is
determining if a loop index variable is incremented inside a loop (this is determined by examing the dynamic slice). Each node has a prior
or conditional probability table associated with it. The failure description node is implicit, since RAID uses a separate belief net for each.
All other nodes, except the “Error Type”, are called evidence nodes.
Let us first consider a scenario in which a diagnosis can
be made with certainty. In this simplified scenario, a runtime fault of the type ‘Divide by Zero’ has occurred. The
variable in question is x and the fault occurred at code line
10. The user submits the faulty program, a file containing
the input data used in this failed execution, the line number
where the error occurred, and the failure type (Divide by
Zero).
RAID first obtains a dynamic slice and the sub-slice on
x (lines 2 and 10 in Figure 1), determines the slice-type is
“set-bad”, then submits this slice and the user-supplied
data to the evaluation module. The evaluation module
begins by selecting a belief net to diagnose the divide by
zero type of failures (Figure 4). Given the slice type and
the finding that the set (x=0) and the failed instructions are
not contained within loops, the evaluation module first
concludes that the set instruction is the initial cause of the
failure. Since this set instruction assigns a constant to x,
RAID concludes that this is the erroneous statement, with
certainty of 100%.
Let us now turn to an example in which the diagnosis
will be uncertain, due to a lack of information. In this
slightly more realistic example, consider the example slice
and sub-slice in Figure 3. Say the user reports that the
variable x has a numeric value higher than expected. In this
example, three hypotheses can explain the failure (1) x was
initially assigned an incorrect value (a “InitError”), (2) the
loop was executed too many times, indicating a problem
with the construction of the loop (“a bad-loop”), or (3) the
calculation inside the loop has a problem with the variable
z or w (a “bad-adjust”). For each of these hypotheses,
nodes in the belief net are instantiated to find evidence to
refute or verify belief in that hypothesis. Rules may
initiate requests for additional sub-slices from the slicing
module. A report of the analysis for one of these
hypotheses is shown in Figure 5.
Future Work
To characterize the value of the RAID system, we plan to
measure accuracy and efficiency. These include:
• Percentage of correct, certain diagnoses
• Percentage of correct, most probable diagnoses
• Percentage of correct, less probable diagnosis
• Time saving - total time to debug a program
compared with using other methods
Future work will allow RAID to perform failure
diagnosis when the input case is not available. This will
require the generation and analysis of multiple execution
paths, as in the DAACS system. While the current
implementation reasons on C language syntax, we plan to
add the capability to debug additional languages, such as
Fortran. This requires a new translator to convert the
program into the abstract representation used by RAID.
Additionally, we intend to study the relaxation of our
assumption that a single program statement caused the
failure.
RAID Debugging Report
Program name: mytest.c
n read as input (value = 10)
Loop executes 10 times
*** Failure (numeric too high)
Hypothesis: Loop executed too many times
(there are 2 other hypotheses)
60%
void main (void)
{
int x, y, z, w, n, i;
z = 0;
scanf("%d %d", &y, &w);
scanf("%d", &n);
x = y;
if ( y > z) {
for (i = 1; i <=n; i++) {
<…some lines of code omitted…>
x = x * y - w;
<…some lines of code omitted…>
}
}
printf("%d", x);
ç user specified failure (numeric too high)
Figure 5. Sample RAID debugging report for a fault type of “Numeric value higher than expected”.
RAID analysis currently ends when the results of the
evaluation module are presented to the user. We hope to
study the conditions under which RAID could carry out the
final step in the debugging task — correcting the failed
program. This involves determining how to automatically
repair and test certain errors when a suspect statement with
a suitable probability has been encountered.
Conclusion
We have presented a prototype system, RAID, for
diagnosing failures in C language programs. RAID
integrates deterministic methods, such as program slicing
and symbolic execution, with probabilistic methods. The
purpose of this integration is two-fold. One is to attempt to
maximize the autonomous diagnostic capability of the
system. This will provide guidance for other work we are
interested in, most notably, the autonomous correction of
intelligent agent software. Second is to provide debugging
tools that can scale to large programs. Preliminary results
show that RAID can perform more of the diagnosis on its
own than other intelligent debugging methods, while
requiring only marginally more computing time. As the
RAID prototype is further developed, controlled metrics
will be conducted to verify these early conjectures.
References
Agrawal, H., Albieri, J., Horgan, J.; Li, J., London, S.,
Wong, W. ,Ghosh, S., Wilde, N. 1998. Mining System
Tests to Aid Software Maintenance. IEEE Computer 31(7):
64-73.
Agrawal, H., De Millo, R., Spafford, E. 1993. Debugging
with Dynamic Slicing and Backtracking. SoftwarePractice and Experience 23(6): 589-616.
Burnell, L.J. and E.J. Horvitz. 1993. A Synthesis of
Logical and Probabilistic Reasoning for Program
Understanding and Debugging. In Proceedings of the Ninth
Conference on Uncertainty in Artificial Intelligence.
Morgan Kaufmann, 285-291.
Burnell, L. and Horvitz, E. 1995. Structure and Chance:
Melding Logic and Probability for Software Debugging.
Communications of the ACM 38(3): 31-57.
Harrold, M., Malloy, B., and Rothermel, G. 1993. Efficient
Construction of Program Dependence Graphs. Technical
Report 93-102, Department of Computer Science, Clemson
University.
Hartman, J. 1992. Technical Introduction to the First
Workshop in Artificial Intelligence and Automated
Program Understanding. Workshop Notes on AI and
Automated Program Understanding. AAAI, 8-30.
Korel, B., and Rilling, J. 1997. Application of Dynamic
Slicing in Program Debugging. In Proceedings of the Third
International Workshop on Automatic Debugging
(AADEBUG'97), Linköping, Sweden.
http://www.ep.liu.se/ea/cis/1997/009/05/
Pan, H., and Spafford, E. 1992. Heuristics for Automatic
Localization of Software Faults. In Proceedings of the 10th
Pacific Northwest Software Quality Conference 192-209.
Pearl, J. 1988. Probabilistic Reasoning in Intelligent
Systems. San Mateo, CA: Morgan Kaufmann.
Reps, T., Rosay, G., and Horwitz, S. 1997. The Wisconsin
Program-Slicing Tool. Release 1.0. .
Rich, C. 1981. Inspection Methods in Programming.
Technical Report MIT/AI/TR-604, MIT Artificial
Intelligence Laboratory, Ph.D. Thesis.
Rugaber, S. 1992. Program Comprehension for Reverse
Engineering. Workshop Notes on AI and Automated
Program Understanding. AAAI, 106-114.
Spafford, E. 1994. Spyder Debugger Project Page.
http://www.cs.purdue.edu/homes/spaf/spyder.html.
Weiser, M. 1981. Program Slicing. Fifth International
Conference on Software Engineering, 439-449.


