International Sentiment Analysis for News and Blogs
Mikhail Bautin
Lohit Vijayarenu
Steven Skiena
Dept. of Computer Science
Stony Brook University
Stony Brook, NY 11794-4400
mbautin@cs.sunysb.edu
Yahoo! Inc.
2MC-04, 2821 Mission College Boulevard
Santa Clara, CA, 95054
lohit@yahoo-inc.com
Dept. of Computer Science
Stony Brook University
Stony Brook, NY 11794-4400
skiena@cs.sunysb.edu
Abstract
sis systems (such as ours) which aggregate sentiment from
multiple documents. In particular, we have generalized the
Lydia sentiment analysis system to monitor international
opinion on a country-by-country basis by aggregating daily
news data from roughly 200 international English-language
papers and over 400 sources partitioned among eight other
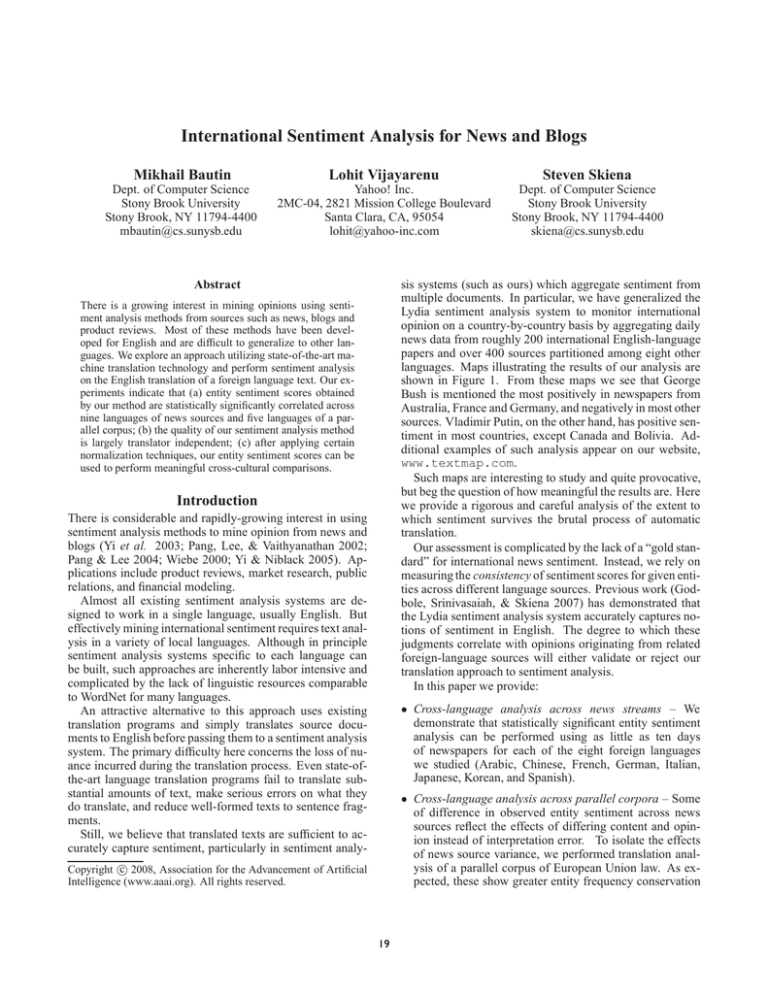
languages. Maps illustrating the results of our analysis are
shown in Figure 1. From these maps we see that George
Bush is mentioned the most positively in newspapers from
Australia, France and Germany, and negatively in most other
sources. Vladimir Putin, on the other hand, has positive sentiment in most countries, except Canada and Bolivia. Additional examples of such analysis appear on our website,
www.textmap.com.
Such maps are interesting to study and quite provocative,
but beg the question of how meaningful the results are. Here
we provide a rigorous and careful analysis of the extent to
which sentiment survives the brutal process of automatic
translation.
Our assessment is complicated by the lack of a “gold standard” for international news sentiment. Instead, we rely on
measuring the consistency of sentiment scores for given entities across different language sources. Previous work (Godbole, Srinivasaiah, & Skiena 2007) has demonstrated that
the Lydia sentiment analysis system accurately captures notions of sentiment in English. The degree to which these
judgments correlate with opinions originating from related
foreign-language sources will either validate or reject our
translation approach to sentiment analysis.
In this paper we provide:
There is a growing interest in mining opinions using sentiment analysis methods from sources such as news, blogs and
product reviews. Most of these methods have been developed for English and are difficult to generalize to other languages. We explore an approach utilizing state-of-the-art machine translation technology and perform sentiment analysis
on the English translation of a foreign language text. Our experiments indicate that (a) entity sentiment scores obtained
by our method are statistically significantly correlated across
nine languages of news sources and five languages of a parallel corpus; (b) the quality of our sentiment analysis method
is largely translator independent; (c) after applying certain
normalization techniques, our entity sentiment scores can be
used to perform meaningful cross-cultural comparisons.
Introduction
There is considerable and rapidly-growing interest in using
sentiment analysis methods to mine opinion from news and
blogs (Yi et al. 2003; Pang, Lee, & Vaithyanathan 2002;
Pang & Lee 2004; Wiebe 2000; Yi & Niblack 2005). Applications include product reviews, market research, public
relations, and financial modeling.
Almost all existing sentiment analysis systems are designed to work in a single language, usually English. But
effectively mining international sentiment requires text analysis in a variety of local languages. Although in principle
sentiment analysis systems specific to each language can
be built, such approaches are inherently labor intensive and
complicated by the lack of linguistic resources comparable
to WordNet for many languages.
An attractive alternative to this approach uses existing
translation programs and simply translates source documents to English before passing them to a sentiment analysis
system. The primary difficulty here concerns the loss of nuance incurred during the translation process. Even state-ofthe-art language translation programs fail to translate substantial amounts of text, make serious errors on what they
do translate, and reduce well-formed texts to sentence fragments.
Still, we believe that translated texts are sufficient to accurately capture sentiment, particularly in sentiment analy-
• Cross-language analysis across news streams – We
demonstrate that statistically significant entity sentiment
analysis can be performed using as little as ten days
of newspapers for each of the eight foreign languages
we studied (Arabic, Chinese, French, German, Italian,
Japanese, Korean, and Spanish).
• Cross-language analysis across parallel corpora – Some
of difference in observed entity sentiment across news
sources reflect the effects of differing content and opinion instead of interpretation error. To isolate the effects
of news source variance, we performed translation analysis of a parallel corpus of European Union law. As expected, these show greater entity frequency conservation
c 2008, Association for the Advancement of Artificial
Copyright Intelligence (www.aaai.org). All rights reserved.
19
(a)
(b)
(a)
(b)
Figure 1: International sentiment maps for (a) George Bush; and (b) Vladimir Putin (best viewed in color).
than variable sources. One does not expect impassioned
sentiment to be revealed in legal codes, yet these results
also show meaningful sentiment consistency.
the sentiment analysis approaches existing for English. We
overview that literature below. Subsequently, we describe
the approach to sentiment analysis implemented by the Lydia system which we are using for our experiments.
• Analysis of translator-specific artifacts – The quality of
our sentiment analysis will depend on the quality of the
language translation software, but how strongly? We
compare the sentiment results on the same source text corpus across two distinct Spanish translators. Aggregated
entity frequency, sentiment polarity, and sentiment subjectivity were highly correlated across both translators,
with results statistically significant beyond p < 0.001.
We conclude that the success of our methods is largely
(but not completely) translator independent.
Cross-language sentiment analysis
The approach taken in (Hiroshi, Tetsuya, & Hideo 2004)
uses machine translation technology to develop a highprecision sentiment analysis system for Japanese at a low
cost. Sentiment unit polarity extraction precision of 89% is
reported.
Mihalcea et al. (Mihalcea, Banea, & Wiebe 2007) discuss methods to automatically generate a subjectivity lexicon and subjectivity-annotated corpora for a new language
(they focus on Romanian) from similar resources available
for English. They achieve a 67.85 F-measure for classifying sentiment orientation of sentences using the subjectivity
resources built for Romanian.
Yao et al. (Yao et al. 2006) propose a method of determining sentiment orientation of Chinese words using a bilingual
lexicon and achieve precision and recall of 92%.
Benamara et al. (Benamara et al. 2007) argue that adverbs
in combination with adjectives are more helpful for sentiment score assignment to individual sentiment units than adjectives alone. Their best algorithm achieves a 0.47 Pearson
correlation with human-assigned scores compared to 0.34
without using adverbs.
The Oasys 2.0 opinion analysis system (Cesarano et al.
2007) allows the user to identify the intensity of opinion on
any topic on a continuous scale, and view how that intensity is changed over countries, news sources, and time. It is
based on aggregation of individual positive and negative references identified using approaches described in (Benamara
et al. 2007; Cesarano et al. 2004) which have been evaluated
on the individual sentiment unit level. Our work, in contrast,
focuses on the evaluation of the final entity sentiment score
rather than individual entity reference polarity.
• Normalizing for cross-cultural language effects – Translator/language effects complicate the problem of comparing entity sentiment across distinct language sources.
Certain languages (e.g. Chinese and Korean) appear to
produce substantially higher sentiment scores than others
(e.g. Italian). We present techniques to correct for such
bias, and present an interesting cross-cultural comparison
of country sentiments by language.
This paper is organized as follows.
First, we review
previous work on foreign language sentiment analysis and
provide an overview of the Lydia sentiment analysis system.
Then we present the experimental methodology underlying
our work. The three sections that follow present our analysis on the consistency of sentiment over corpora designed
to isolate the effects of news variance, language variance,
and translator variance respectively. Issues associated with
comparing sentiment across languages are presented in the
Cross-Cultural Observations section, followed by our conclusions.
Previous Work
There has been a wide research effort on analyzing sentiment in languages other than English by applying bilingual resources and machine translation techniques to employ
20
The Lydia sentiment analysis system
Language
Japanese
Korean
Arabic (research)
Chinese
Spanish (research)
German
Italian
French
Spanish (WTS)
Our work is based on the Lydia text analysis system (Godbole, Srinivasaiah, & Skiena 2007; Kil, Lloyd, & Skiena
2005; Lloyd, Kechagias, & Skiena 2005; Lloyd, Mehler, &
Skiena 2006; Mehler et al. 2006). The Lydia system recognizes named entities in text and extracts their temporal and
spatial distribution. Text sources are spidered daily by customized website scrapers that convert articles to a standard
format and store them in an archive. Then, on a daily basis,
the articles are run through a pipeline that performs part-ofspeech tagging, named entity identification and categorization, geographic normalization, intradocument coreference
resolution, extraction of entity descriptions and relations between entities, and per-occurrence sentiment score calculation. The entities are then inserted into a database, and crossdocument coreference resolution, entity juxtaposition score
and per-entity sentiment score calculation take place.
Sentiment score calculation in Lydia is described in (Godbole, Srinivasaiah, & Skiena 2007). As a preliminary step,
the sentiment lexicon is constructed. Starting from sets
of seed positive and negative adjectives, their polarity is
propagated through WordNet (Miller 1995) synonym and
antonym links, and every adjective is assigned a polarity
score. Then, the top fraction of adjectives from both extremes of this curve are placed into positive and negative
parts of the sentiment lexicon respectively.
The next step is entity sentiment calculation in a specific corpus. Using the existing sentiment lexicon, positive and negative word occurrences are marked up in the
corpus. For every entity and every day i, the number of
positive and negative sentiment words co-occurring with
that entity in the same sentence (pos sentiment refs i and
neg sentiment refs i ) are calculated. For every entity, its
polarity score on a given day i is then calculated as
pos sentiment refs i
(1)
entity polarity i =
total sentiment refs i
and its subjectivity score as
total sentiment refs i
entity subjectivity i =
. (2)
total occurrences i
The polarity score reflects whether the sentiment associated
with the entity is positive or negative, and the subjectivity
score—how much sentiment of any polarity the entity receives. These are the two measures of entity sentiment that
we use in our analysis.
µuntrans
0.001
0.002
0.005
0.008
0.091
0.099
0.167
0.316
0.399
σuntrans
0.008
0.024
0.043
0.070
0.082
0.119
0.153
0.228
0.252
µout /in
1.149
0.959
0.774
1.459
0.989
0.964
0.992
0.950
0.966
σout /in
0.133
0.135
0.302
0.197
0.083
0.137
0.051
0.108
0.148
Table 1: Mean and standard deviation of the overlap between
original and translated text (µuntrans , σuntrans ) and of the
ratio of translator output to input size (µout/in , σout /in ).
the original language. We conjectured that a higher quality translator would leave a lower fraction of text untranslated, and compared source text with translator output using a maximum overlap dynamic programming algorithm
at the word level. Higher values of this overlap indicate
larger numbers of words that did not get translated. This is
particularly important to us because we need entity names
to be translated correctly to English to be able to match
them across language boundaries. Table 1 shows these overlap values for different languages, along with the ratio of
translator output to input size, averaged across all articles.
Japanese, Korean, Arabic and Chinese understandably show
lowest overlap values, since the scripts used in these languages do not allow for a direct inclusion of untranslated
text into the English output. But for the European languages
the situation is different: up to 40% of the input text is left
untranslated. Note the difference in the overlap value between two Spanish translators: the translation server hosted
by IBM Research and WebSphere Translation Server. In the
Cross-Translator Analysis section we further explore the differences between these two translators.
The same entity may be referenced differently in different languages. To partially account for that, we remove
language-specific stopwords such as “la” and “le” for French
and “la”/“el” for Spanish, to produce the entity’s canonical
name. We use these canonical names to match entities across
languages in our experiments.
News stream analysis
We computed daily entity sentiment scores over ten days
from May 1 to May 10, 2007 for entities extracted from a
subset of news text translated from Arabic, Chinese, French,
German, Italian, Japanese, Korean and Spanish to English,
as well as from a number of major U.S. newspapers. This
specific time period was chosen because it has the most consistent spidered news volume over a contiguous period of
time in our dataset. Only 19 entities proved common to
all nine databases, out of which 14 were countries (France,
America, China, Japan, Italy, Canada, Iran, Turkey, India,
Australia, Sudan, Pakistan, Vietnam, Singapore), and four
were cities (Washington DC, London, Moscow, Tokyo).
For each pair of languages Table 2 shows the cardinality
of intersection of entity sets extracted from these languages.
Methodology
We spider online newspapers in nine languages: Arabic,
Chinese, English, French, German, Italian, Japanese, Korean, and Spanish. In our experiments we used 7-39 newspaper sources for each language, with the fewest sources for
Chinese and Italian, and 21,000 articles per language on average. We translate foreign text to English using IBM WebSphere Translation Server (WTS). For Spanish and Arabic,
we also used an newer experimental translator hosted as a
web service by IBM Research.
We noticed that for many words that WTS is unable to
translate to English it leaves them in the output text in
21
London, GBR
Israel
1.0
0.8
Polarity Score
Polarity Score
1.0
Arabic
German
Italian
Spanish
0.6
0.4
0.2
0.0
0.8
Chinese
German
Italian
0.6
0.4
0.2
0.0
1
2
3
4
5
6
7
8
9 10
1
Figure 2: Polarity score of London in Arabic, German, Italian and Spanish over the May 1-10, 2007 period.
2
3
4
6
7
8
9 10
Figure 4: Polarity score of Israel in Chinese, German and
Italian over the May 1-10, 2007 period.
Egypt
Baghdad, IRQ
1.0
Polarity Score
1.0
Polarity Score
5
0.8
Arabic
French
German
0.6
0.4
0.2
0.8
Arabic
Chinese
German
0.6
0.4
0.2
0.0
0.0
1
2
3
4
5
6
7
8
1
9 10
2
3
4
5
6
7
8
9 10
Figure 3: Polarity score of Baghdad in Arabic, French and
German over the May 1-10, 2007 period.
Figure 5: Polarity score of Egypt in Arabic, Chinese and
German over the May 1-10, 2007 period.
From this table we can observe that the Korean entities are
mostly related to the Chinese and Japanese. Out of the three
Asian languages, the Japanese entities are the most connected to the European languages, which also form a strong
cluster by themselves according to this distance measure.
us to conjecture the presence of a common underlying factor
influencing entity sentiment in all languages—such as the
“real” positivity or negativity of an entity.
To look for the underlying reasons of the interdependencies between entity polarity scores in different languages,
we analyzed the correlations between polarity scores of the
same entity in different languages over our ten-day experiment time period. Figure 2 shows the sentiment score of
London in four languages. An explanation of the consistent
drop on May 10 could be the arrest of four people in the
United Kingdom in connection with the July 7, 2005 London bombings. In Figure 3 the polarity score drop starting
May 6 is explained by the car bomb exploding in Baghdad
on that day. The spike on May 3 in the polarity score of
Egypt in Figure 5 coincides with the launch of the International Compact for Iraq at Sharm El-Sheikh, Egypt. The
drop in the polarity score of Israel on May 3-6 can be attributed to the protests against Prime Minister Ehud Olmert
and his government over their handling of the 2006 Lebanon
War. These examples indicate that in cases of significant
correlation between sentiment scores in different languages
there are often real-world explanations of changes in these
scores.
News entity frequency correlations
The top part of Table 3 shows entity frequency correlation
for every pair of languages. Every sample in this correlation is an aggregated frequency for a given entity in a given
language over all ten days of the time period considered.
The correlations significant with p < 0.05 according to a
two-sided Student’s t-test are highlighted with bold. We
found no statistically significant entity frequency correlations when the frequency of each entity for each day was
treated as a single sample. Note that daily correlation analysis is complicated by inconsistent notions of what a “day”
is across different time zones and spidering patterns. Table
3 shows that English reaches a significant correlation with
all other languages in the experiment, emphasizing its central role in our multi-language analysis approach. Figure
6 depicts these frequency correlation relations in a graphical form, making the clustering of European languages and
Arabic versus Chinese, Japanese and Korean evident.
Parallel Corpus Analysis
News entity polarity correlations
We also analyzed entity sentiment scores in the European
Commission Joint Research Centre’s Acquis multilingual
parallel corpus (Ralf et al. 2006). This corpus contains the
total body of European Union (EU) law applicable in the
EU Member States. The JRC-Acquis corpus does not con-
Table 3 (middle) shows that entity polarity scores aggregated
over the whole time period of experiments are significantly
correlated for most pairs of languages—much more so than
frequencies (top) or subjectivities (bottom) are. This allows
22
Arabic
Chinese
English
French
German
Italian
Japanese
Korean
Spanish
Arabic
7601
679
1403
1080
1053
552
193
195
1114
Chinese
679
31783
1124
941
1064
439
199
808
947
English
1403
1124
24452
2282
1989
735
221
281
2086
French
1080
941
2282
10911
1749
748
194
252
1818
German
1053
1064
1989
1749
17882
704
201
303
1638
Italian
552
439
735
748
704
2662
138
132
816
Japanese
193
199
221
194
201
138
800
98
196
Korean
195
808
281
252
303
132
98
2870
244
Spanish
1114
947
2086
1818
1638
816
196
244
12843
Arabic
Chinese
English
French
German
Italian
Japanese
Korean
Spanish
Arabic
100%
9%
18%
14%
14%
21%
24%
7%
15%
Chinese
9%
100%
5%
9%
6%
16%
25%
28%
7%
English
18%
5%
100%
21%
11%
28%
28%
10%
16%
French
14%
9%
21%
100%
16%
28%
24%
9%
17%
German
14%
6%
11%
16%
100%
26%
25%
11%
13%
Italian
21%
16%
28%
28%
26%
100%
17%
5%
31%
Japanese
24%
25%
28%
24%
25%
17%
100%
12%
24%
Korean
7%
28%
10%
9%
11%
5%
12%
100%
9%
Spanish
15%
7%
16%
17%
13%
31%
24%
9%
100%
Table 2: Numbers of entities in intersections of each pair of languages (top) and percentage numbers that indicate the ratio of
the intersection size to the smallest number of entities available for either of the two languages being intersected (bottom).
Frequency correlations
Arabic
Chinese
English
French
German
Italian
Japanese
Korean
Spanish
Arabic
1.00 (2199)
Chinese
0.37 (141)
1.00 (1051)
English
0.36 (500)
0.24 (176)
1.00 (12613)
French
0.28 (397)
0.08 (141)
0.30 (1006)
1.00 (3769)
Arabic
1.00 (2199)
Chinese
0.56 (141)
1.00 (1051)
English
0.49 (500)
0.24 (176)
1.00 (12613)
French
0.45 (397)
0.51 (141)
0.53 (1006)
1.00 (3769)
Arabic
1.00 (2199)
Chinese
-0.05 (141)
1.00 (1051)
English
0.03 (500)
0.17 (176)
1.00 (12613)
German
0.33 (390)
0.32 (147)
0.33 (763)
0.38 (650)
1.00 (4291)
Italian
0.25 (190)
0.10 (94)
0.36 (252)
0.45 (249)
0.33 (242)
1.00 (768)
Japanese
0.19 (78)
0.74 (59)
0.41 (83)
0.06 (74)
0.11 (74)
0.09 (56)
1.00 (241)
Korean
0.73 (51)
0.18 (52)
0.27 (62)
0.10 (57)
0.17 (58)
0.11 (34)
0.40 (35)
1.00 (416)
Spanish
0.17 (210)
0.04 (95)
0.31 (301)
0.21 (264)
0.14 (223)
0.27 (135)
0.25 (58)
0.20 (38)
1.00 (980)
Italian
0.57 (190)
0.41 (94)
0.58 (252)
0.45 (249)
0.37 (242)
1.00 (768)
Japanese
0.36 (78)
0.08 (59)
0.46 (83)
0.51 (74)
0.26 (74)
0.58 (56)
1.00 (241)
Korean
0.26 (51)
0.44 (52)
0.35 (62)
0.63 (57)
0.33 (58)
0.48 (34)
0.35 (35)
1.00 (416)
Spanish
0.61 (210)
0.49 (95)
0.49 (301)
0.40 (264)
0.26 (223)
0.35 (135)
0.46 (58)
0.40 (38)
1.00 (980)
Italian
0.23 (190)
0.10 (94)
0.23 (252)
0.18 (249)
0.21 (242)
1.00 (768)
Japanese
0.09 (78)
-0.03 (59)
0.13 (83)
0.21 (74)
0.28 (74)
0.21 (56)
1.00 (241)
Korean
0.00 (51)
0.20 (52)
0.27 (62)
-0.13 (57)
0.35 (58)
-0.02 (34)
0.63 (35)
1.00 (416)
Spanish
0.39 (210)
-0.04 (95)
0.07 (301)
0.16 (264)
-0.00 (223)
0.37 (135)
0.25 (58)
0.08 (38)
1.00 (980)
Polarity correlations
Arabic
Chinese
English
French
German
Italian
Japanese
Korean
Spanish
German
0.48 (390)
0.42 (147)
0.53 (763)
0.53 (650)
1.00 (4291)
Subjectivity correlations
Arabic
Chinese
English
French
German
Italian
Japanese
Korean
Spanish
French
0.16 (397)
0.22 (141)
0.13 (1006)
1.00 (3769)
German
0.12 (390)
0.27 (147)
0.23 (763)
0.22 (650)
1.00 (4291)
Table 3: Pearson correlation of frequency, polarity and subjectivity scores for entities extracted from the news corpus. All
entities in the intersection are included in comparison. Counts are aggregated over all days for every entity. Bold correlations
are significant with p < 0.05.
23
America
French
Polarity Score
Italian
1.0
German
Spanish
Arabic
0.8
Spanish (1)
Spanish (2)
0.6
0.4
0.2
0.0
English
1
2
3
4
5
6
7
8
9 10
Figure 7: Polarity scores of America in the output of (1)
IBM WebSphere Translation Server Spanish translator; (2)
a newer translator hosted by IBM Research.
Chinese
Korean
Japanese
two translators.
Looking at polarity as a function of time in the output of
the two translators, we see that the two scores can be fairly
consistent (Figure 7). Still, the ten-day aggregated scores
were more concordant.
Figure 6: Graph of significantly correlated entity frequencies in different languages in the news corpus.
Cross-Cultural Observations
tain timestamp information for documents, making temporal
analysis impossible. However, we can still analyze correlations of entity frequencies and sentiment scores between
different languages. We performed our experiments with
five languages out of the 22 in which the JRC-Acquis corpus is available: English, French, German, Italian and Spanish. The documents in languages other than English were
first translated to English using IBM WebSphere Translation Server, and the resulting translated documents were processed through our Lydia pipeline, giving a subjectivity and
polarity score for each entity as a result.
Table 4 shows entity frequency, polarity score and subjectivity score correlations in the JRC-Acquis corpus for pairs
of languages, analogous to Table 3 for the news corpus. We
observe greater frequency and subjectivity correlation between languages in the JRC-Acquis corpus than in the news
corpus. This is consistent with expectations because unlike
the news corpus, the same text is used in all languages in
the JRC corpus. Even though one should not expect strong
sentiment expression in law documents, polarity scores also
show substantial consistency.
To explore the suitability of our scores for cross-cultural
comparisons, we calculated polarity scores of all countries appearing in at least 7 out of our 9 language-specific
databases, in every language. To quantify how comparable
entity scores are between languages, we calculated the variance of each entity’s polarity score across languages. With
polarity scores calculated as in (1), the variance was at most
0.068 and the sum of variances across all languages was
0.525.
One source of the differences in polarity scores between
languages follows from different probabilities of positive
and negative sentiment word appearance in the same sentence with an entity. To account for this bias, we calculated the average numbers of positive and negative sentiment
words per entity occurrence:
PNentities
pos sentiment refs i
pos per ref = Pi=1
Nentities
total occurrences i
i=1
PNentities
neg sentiment refs i
neg per ref = Pi=1
Nentities
total occurrences i
i=1
Table 6 gives values of these statistics for all languages.
The neg coef /pos coef line shows that Korean is the most
biased language towards positive sentiment, and Italian is
the most biased towards negative, although not much more
than English is. We discount each positive or negative sentiment word occurrence in i’th language versus English:
pos per ref English
pos coef i =
pos per ref i
Cross-Translator Analysis
Since two different translators were available to us for
the Spanish language, it was natural to compare sentiment
scores of entities in the output of these two translators. We
found that when we aggregated sentiment scores over the
entire ten-day period for every entity, the resulting correlations of entity polarity, subjectivity and frequency were 0.52,
0.46 and 0.47 respectively, all with p < 0.001 significance.
When entity scores on individual days were treated separately, however, these correlations went down to 0.19 for
polarity, 0.45 for subjectivity and 0.42 for frequency. This
indicates that there is a high variance in the amount of positive and negative references but little difference in the overall
volume of subjective references between the outputs of the
neg per ref English
neg per ref i
We then calculate the normalized polarity as
pos sentiment refs i
neg coef i =
pos sentiment refs i +
24
neg coef
pos coef
× neg sentiment refs i
Frequency correlations
English
French
German
Italian
Spanish
English
1.00 (619)
French
0.21 (144)
1.00 (342)
English
1.00 (619)
French
0.21 (144)
1.00 (342)
German
0.20 (186)
0.06 (135)
1.00 (1460)
Italian
0.64 (196)
0.67 (153)
0.13 (172)
1.00 (484)
Spanish
0.59 (181)
0.78 (152)
0.17 (166)
0.83 (192)
1.00 (527)
Italian
0.45 (196)
0.42 (153)
0.20 (172)
1.00 (484)
Spanish
0.25 (181)
0.30 (152)
0.11 (166)
0.43 (192)
1.00 (527)
Italian
0.43 (196)
0.64 (153)
0.66 (172)
1.00 (484)
Spanish
0.28 (181)
0.52 (152)
0.75 (166)
0.60 (192)
1.00 (527)
Polarity correlations
English
French
German
Italian
Spanish
German
0.09 (186)
0.09 (135)
1.00 (1460)
Subjectivity correlations
English
French
German
Italian
Spanish
English
1.00 (619)
French
0.24 (144)
1.00 (342)
German
0.62 (186)
0.40 (135)
1.00 (1460)
Table 4: Pearson correlations of frequency, polarity and subjectivity for entities extracted from the JRC-Acquis corpus. All
entities in the intersection are included in comparison. Bold correlations are significant with p < 0.05.
Cameroon
Lebanon
Pakistan
Philippines
Iraq
Cuba
USA
Sudan
Venezuela
Mexico
Canada
China
Germany
Egypt
Australia
America
India
Chile
Argentina
Spain
Japan
Italy
Austria
Saudi Arabia
France
Brazil
Switzerland
Jordan
Belgium
Arabic
0.295
0.404 (1)
0.393
0.462
0.346 (7)
0.422
0.404
0.500 (4)
0.241
0.561
0.531
0.556
0.483
0.519 (5)
0.493
0.405
0.571
0.576
0.461
0.583
0.689
0.554
0.515
0.611 (3)
0.561
0.557
0.628
0.678 (4)
0.652
Chinese
0.528
0.327
0.254
0.388
0.535
0.692
0.561
0.509
1.000
0.859
0.522
0.420 (9)
0.421
0.823
0.528
0.651
0.626
0.405
0.430
0.629
0.531
0.605
N/A
N/A
0.688
0.848
0.455
0.931
0.754
English
0.219
0.311
0.456 (2)
0.378 (6)
0.372
0.299
0.545 (2)
0.444
0.468
0.385
0.498 (6)
0.433
0.480
0.540
0.541 (3)
0.568 (4)
0.487 (8)
0.586
0.472
0.466
0.542
0.465
0.489
0.458
0.611
0.494
0.527
0.569
0.643
French
0.155 (7)
0.208
0.321
0.428
0.275
0.414
0.456
0.438
0.350
0.423
0.508
0.473
0.598
0.361
0.560
0.502
0.547
0.559
0.654
0.468
0.602
0.557
0.507
0.564
0.566 (8)
0.516
0.697
0.414
0.621 (6)
German
0.161
0.251
0.313
0.440
0.354
0.447
0.436
0.437
0.569
0.387
0.705
0.470
0.639 (2)
0.576
0.508
0.566
0.396
0.563
0.624
0.533
0.397
0.536
0.568 (4)
0.446
0.570
N/A
0.607 (5)
0.739
0.583
Italian
0.158
N/A
0.326
N/A
N/A
0.545
0.520
0.659
0.155
N/A
0.420
0.622
0.680
0.419
0.738
0.605
0.499
0.750
0.738
0.720
0.668
0.615 (2)
0.575
0.556
0.673
0.518
0.559
0.592
0.659
Japanese
N/A
0.375
0.583
0.191
0.414
0.125
N/A
0.358
0.732
N/A
0.450
0.612
0.561
0.355
0.506
0.666
0.719
N/A
N/A
N/A
0.589 (5)
1.000
0.672
0.891
0.611
0.911
1.000
0.432
N/A
Korean
N/A
N/A
0.311
0.443
0.498
N/A
N/A
0.574
N/A
0.469
0.478
0.540
N/A
0.846
0.533
0.480
0.623
N/A
N/A
N/A
0.534
0.454
N/A
N/A
0.569
N/A
N/A
N/A
N/A
Spanish
0.566
0.258
0.286
N/A
0.396
0.402 (6)
0.305
N/A
0.477 (4)
0.533 (3)
0.573
0.663
0.434
0.463
0.519
0.550
0.555
0.502 (6)
0.562 (4)
0.613 (3)
0.648
0.417
0.851
0.669
0.602
0.529 (4)
0.676
0.843
0.754
Mean
0.297
0.305
0.360
0.390
0.399
0.418
0.461
0.490
0.499
0.517
0.521
0.532
0.537
0.545
0.547
0.555
0.558
0.563
0.563
0.573
0.578
0.578
0.597
0.599
0.606
0.625
0.644
0.650
0.666
StdDev
0.178
0.070
0.103
0.093
0.084
0.166
0.090
0.093
0.272
0.166
0.083
0.088
0.097
0.181
0.074
0.083
0.093
0.104
0.115
0.092
0.090
0.172
0.128
0.151
0.047
0.176
0.164
0.185
0.065
Table 5: Normalized country polarity scores in all languages. Countries are sorted by their mean score across all languages.
Polarity scores are normalized to bring mean polarity to 0 and variance to 1 across all country entities in each language. The
language spoken in the country is highlighted with bold. For every country the rank of its polarity in its own language in the
row (1=highest, 9=lowest) is given in parentheses. Maximum polarity for each country is italicized.
25
Arabic
0.987
0.622
0.906
1.334
1.473
pos per ref
neg per ref
pos coef
neg coef
neg coef /pos coef
Chinese
0.039
0.025
22.719
33.443
1.472
English
0.894
0.830
1.000
1.000
1.000
French
0.669
0.438
1.337
1.893
1.416
German
0.440
0.350
2.033
2.369
1.165
Italian
0.438
0.458
2.042
1.813
0.888
Japanese
0.629
0.598
1.422
1.389
0.977
Korean
1.333
0.717
0.671
1.157
1.726
Spanish
0.509
0.448
1.758
1.853
1.054
Table 6: Normalization coefficients for all languages.
Godbole, N.; Srinivasaiah, M.; and Skiena, S. 2007.
Large-Scale Sentiment Analysis for News and Blogs. In
ICWSM’07.
Hiroshi, K.; Tetsuya, N.; and Hideo, W. 2004. Deeper
sentiment analysis using machine translation technology.
In COLING ’04, 494. Morristown, NJ, USA: ACL.
Kil, J. H.; Lloyd, L.; and Skiena, S. 2005. Question Answering with Lydia. In The Fourteenth Text Retrieval Conference (TREC) Proceedings.
Lloyd, L.; Kechagias, D.; and Skiena, S. 2005. Lydia: A
system for large-scale news analysis. In SPIRE, 161–166.
Lloyd, L.; Mehler, A.; and Skiena, S. 2006. Identifying
co-referential names across large corpora. In CPM, 12–23.
Mehler, A.; Bao, Y.; Li, X.; Wang, Y.; and Skiena, S. 2006.
Spatial Analysis of News Sources. In IEEE Trans. Vis.
Comput. Graph., volume 12, 765–772.
Mihalcea, R.; Banea, C.; and Wiebe, J. 2007. Learning
multilingual subjective language via cross-lingual projections. In ACL’07, 976–983.
Miller, G. A. 1995. WordNet: a lexical database for English. Commun. ACM 38(11):39–41.
Pang, B., and Lee, L. 2004. A sentimental education: Sentiment analysis using subjectivity summarization based on
minimum cuts. In Proceedings of the ACL, 271–278.
Pang, B.; Lee, L.; and Vaithyanathan, S. 2002. Thumbs up?
sentiment classification using machine learning techniques.
In EMNLP’02.
Ralf, S.; Pouliquen, B.; Widiger, A.; Ignat, C.; Erjavec,
T.; Tufi, D.; and Varga, D. 2006. The JRC-Acquis: A
multilingual aligned parallel corpus with 20+ languages.
In Proceedings of LREC’2006.
Wiebe, J. 2000. Learning subjective adjectives from corpora. In AAAI/IAAI, 735–740.
Yao, J.; Wu, G.; Liu, J.; and Zheng, Y. 2006. Using
bilingual lexicon to judge sentiment orientation of chinese
words. cit 0:38.
Yi, J., and Niblack, W. 2005. Sentiment mining in webfountain. In ICDE’05, 1073–1083. Washington, DC, USA:
IEEE Computer Society.
Yi, J.; Nasukawa, T.; Bunescu, R.; and Niblack, W. 2003.
Sentiment analyzer: Extracting sentiments about a given
topic using natural language processing techniques. In
ICDM ’03, 427. Washington, DC, USA: IEEE Computer
Society.
This technique reduces the sum of cross-language polarity
score variances for countries by 6% to 0.494. The normalized polarity scores are given in Table 5.
From the standard deviation column of Table 5 we can
see that the lowest polarity variance corresponds to developed countries (France, Belgium, Australia, Canada, USA)
or countries with recent conflicts (Lebanon, Iraq), and the
highest variance corresponds to developing countries such
as Jordan, Egypt, Venezuela and Brazil.
We also hypothesized that for every country its own language would rank it among the highest. To test this, we included the rank (1=highest, 9=lowest) of country’s polarity
in its own language among all languages in Table 5. There
is little evidence in favor of this hypothesis, perhaps because
ten days is too short a time period to capture a long-time
country sentiment in the news.
Conclusions
Using our Lydia text analysis system, we analyzed entity
sentiment in of newspapers in nine languages, and in five
languages of a parallel corpus. Our experiments showed that
our method of calculating entity sentiment scores is consistent with respect to varying languages and news sources.
We also compared scores across two different translators
for Spanish and concluded that the success of our methods is largely translator independent. Finally, we proposed a
sentiment score normalization technique for cross-language
polarity comparison, allowing for meaningful cross-cultural
comparisons.
Acknowledgments
The authors would like to thank Abe Ittycheriah and Salim
Roukos of IBM Research for their help with IBM WebSphere Translation Server. We thank Sagar Pilania for his
work on the international map infrastructure.
References
Benamara, F.; Cesarano, C.; Picariello, A.; Reforgiato, D.;
and Subrahmanian, V. 2007. Sentiment analysis: Adjectives and adverbs are better than adjectives alone. In
ICWSM’07, 203–206.
Cesarano, C.; Dorr, B.; Picariello, A.; Reforgiato, D.;
Sagoff, A.; and Subrahmanian, V. 2004. Oasys: An opinion
analysis system. In AAAI Spring symposium on Computational Approaches to Analyzing Weblogs.
Cesarano, C.; Picariello, A.; Reforgiato, D.; and Subrahmanian, V. 2007. The OASYS 2.0 Opinion Analysis System. In ICWSM’07, 313–314.
26

