FLAT TOP SAMPLING AND DISCRETE-TIME MODELING by Laurence G. Hassebrook 10-4-07
advertisement
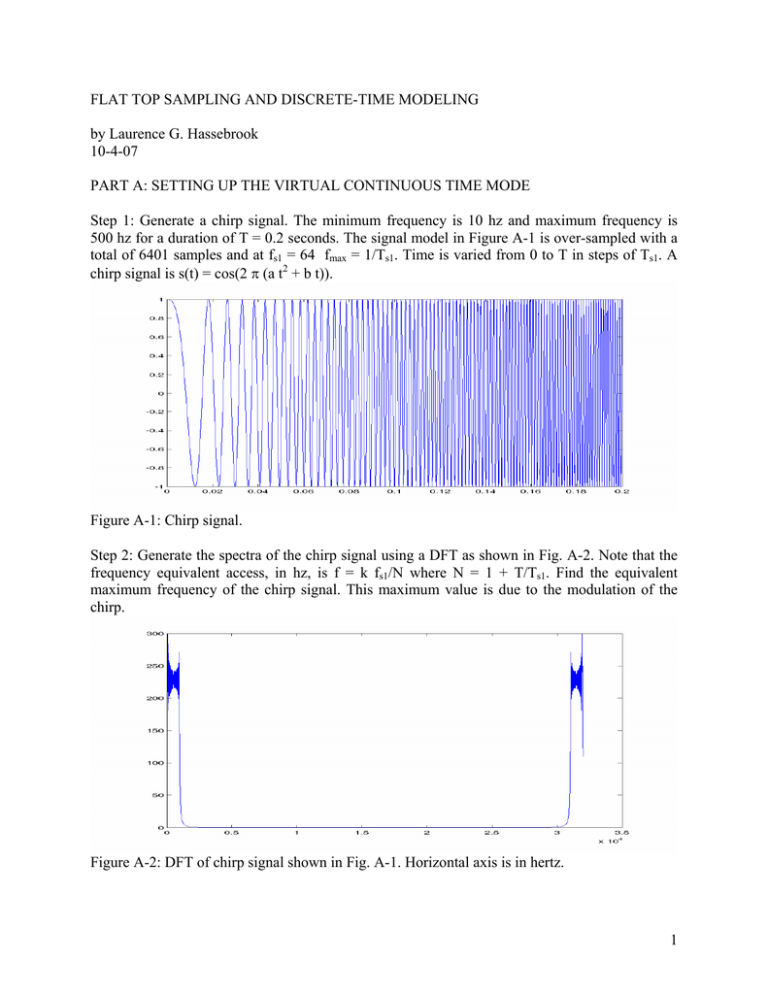
FLAT TOP SAMPLING AND DISCRETE-TIME MODELING by Laurence G. Hassebrook 10-4-07 PART A: SETTING UP THE VIRTUAL CONTINUOUS TIME MODE Step 1: Generate a chirp signal. The minimum frequency is 10 hz and maximum frequency is 500 hz for a duration of T = 0.2 seconds. The signal model in Figure A-1 is over-sampled with a total of 6401 samples and at fs1 = 64 fmax = 1/Ts1. Time is varied from 0 to T in steps of Ts1. A chirp signal is s(t) = cos(2 π (a t2 + b t)). Figure A-1: Chirp signal. Step 2: Generate the spectra of the chirp signal using a DFT as shown in Fig. A-2. Note that the frequency equivalent access, in hz, is f = k fs1/N where N = 1 + T/Ts1. Find the equivalent maximum frequency of the chirp signal. This maximum value is due to the modulation of the chirp. Figure A-2: DFT of chirp signal shown in Fig. A-1. Horizontal axis is in hertz. 1 PART B: MODEL THE FLAT TOP SAMPLING PROCESS Step 1: Flat top sample the signal in Fig. A-1. The result should be the same length even though the sampling rate, fs2, is only twice Nyquist which is about 8 fmax. Explain why the Nyquist rate is 4 fmax instead of 2 fmax, by referring to Fig. A-2. Example is shown in Fig. B-1. Figure B-1: Flat top sampled chirp signal. Step 2: Construct a reconstruction filter that has a bandwith of fs2/2. Figure B-2: Spectrum of flat top sampled chirp with reconstruction filter spectrum superimposed in green. Step 3: Reconstruct the chirp signal from the flat top sampled one. Show results similar to Fig. B-3. 2 Figure B-3: Reconstructed Chirp signal. PART C: UNDERSAMPLED FLAT TOP SAMPLING Repeat part B, but at a sampling rate that is half of Nyquist. Figure C-1: Reconstructed chirp signal when under-sampled. 3
