Automatic Sample-by-sample Model Selection Between Two Off-the-shelf Classifiers Steve P. Chadwick
advertisement

From: AAAI-99 Proceedings. Copyright © 1999, AAAI (www.aaai.org). All rights reserved.
Automatic Sample-by-sample Model Selection Between Two
Off-the-shelf Classifiers
Steve P. Chadwick
University of Texas at Dallas
P.O. Box 830688, EC3.1
Richardson, Texas 75083
chadwick@utdallas.edu
If one could predict which of two classifiers will correctly classify a particular sample, then one could use
the better classifier. Continuing this selection process
throughout the data set should result in improved accuracy over either classifier alone. Fortunately, scalar
measures which relate to the degree of confidence that
we have in a classification can be computed for most
common classifiers (Hastie & Tibshirani 1996). Some
examples of confidence measures are distance from a
linear discriminant separating plane (Duda & Hart
1973), distance to the nearest neighbor, distance to
the nearest unlike neighbor, and distance to the center
of correctly classified training data. We propose to apply discriminant analysis to the confidence measures,
producing a rule which determines when one classifier
is expected to be more accurate than the other.
Let q1 (x) and q2 (x) be scalar functions for the confidence measures of two off-the-shelf classifiers. Each
sample, xi , is mapped to (q1 (xi), q2 (xi )) in the decision space for selecting a classifier, thus the decision
space has only two dimensions. Observe that the sample space has d-dimensions where d is the number of
features in the sample. In this respect the dimensionality of selecting the classifier is reduced from d to 2.
In order to select the better classifier, we need an estimate of where each classifier succeeds or fails. Both
classifiers are applied to each training sample to create this estimate. Classifiers which never misclassify a
training sample, such as nearest neighbors, are evaluated by leave-one-out runs. Each training sample
now has two confidence values, one from each confidence function. It is also known whether each classifier
has correctly classified each of the training samples.
This classification information is used to associate a
value selected from {−1, 0, 1} with each training sample. This value is termed correctness.
(
correctness =
1, if first is best;
0, if both the same;
−1, if second is best.
If the first classifier is correct and the second classifier is incorrect, the correctness value is 1. Conversely,
c
Copyright 1999,
American Association for Artificial
Intelligence (www.aaai.org). All rights reserved.
if the first classifier is incorrect and the second classifier is correct, the correctness value is −1. If both
classifiers perform the same, the correctness value is
0. The confidence values with non-zero correctness are
treated as two-dimensional coordinates and class so a
linear discriminant can be applied to the correctness
data.
This linear discriminant is the rule used to select the
classifier for each testing sample. The linear discriminant provides weights w1 and w2 and threshold t. For
testing sample xi and confidence functions q1 and q2 ,
the second classifier is used if w1 q1 (xi) + w2 q2 (xi) ≤ t,
otherwise the first classifier is used.
While Arcing (Breiman 1996) also uses misclassification, it produces many classifiers and uses voting to
classify a sample. Our technique uses an additional
classifier to select which original classifier is used to
classify a sample. In this respect our technique is similar to Stacked Generalization (Wolpert 1992).
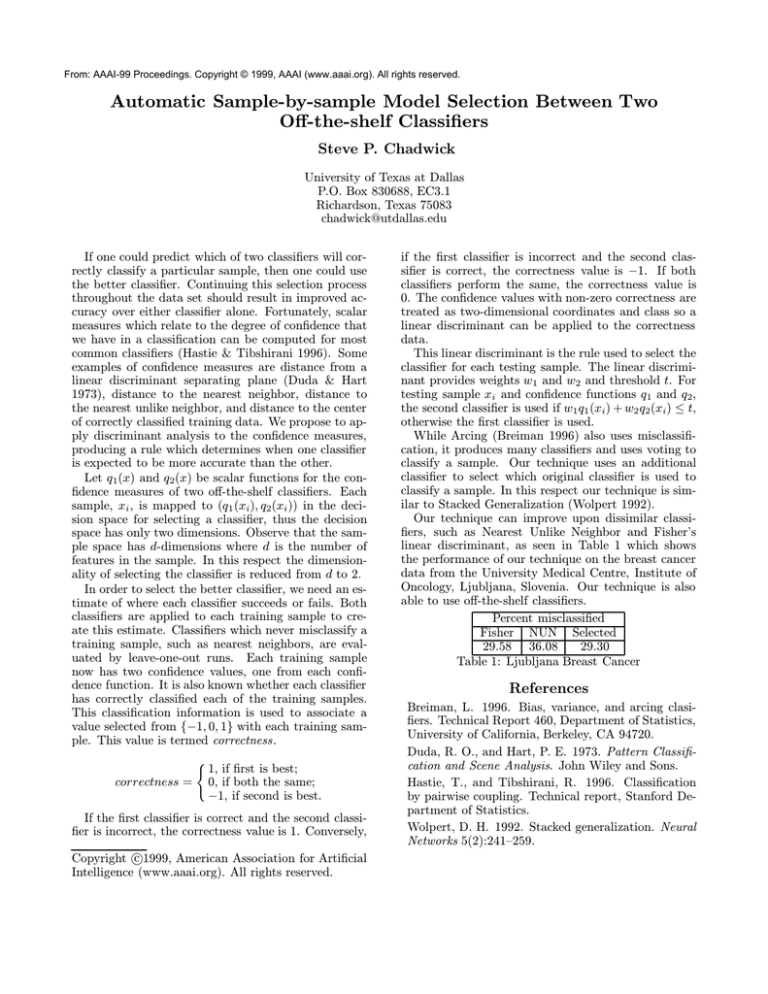
Our technique can improve upon dissimilar classifiers, such as Nearest Unlike Neighbor and Fisher’s
linear discriminant, as seen in Table 1 which shows
the performance of our technique on the breast cancer
data from the University Medical Centre, Institute of
Oncology, Ljubljana, Slovenia. Our technique is also
able to use off-the-shelf classifiers.
Percent misclassified
Fisher NUN Selected
29.58 36.08
29.30
Table 1: Ljubljana Breast Cancer
References
Breiman, L. 1996. Bias, variance, and arcing clasifiers. Technical Report 460, Department of Statistics,
University of California, Berkeley, CA 94720.
Duda, R. O., and Hart, P. E. 1973. Pattern Classification and Scene Analysis. John Wiley and Sons.
Hastie, T., and Tibshirani, R. 1996. Classification
by pairwise coupling. Technical report, Stanford Department of Statistics.
Wolpert, D. H. 1992. Stacked generalization. Neural
Networks 5(2):241–259.
![[ ] ( )](http://s2.studylib.net/store/data/010785185_1-54d79703635cecfd30fdad38297c90bb-300x300.png)


