From: AAAI-83 Proceedings. Copyright ©1983, AAAI (www.aaai.org). All rights reserved.
T. E. Weymouth,
J. S. Grifftth, A. R. Hanson and E. M. Rtseman
Department of Computer and hformatbn Z%kme,
htversity of Massachusetts at Amkfstl
member
of a restricted
class of scenes (e.g., suburban
house
scenes).
The systems developed
by Ghta [q for understanding
images of buildings in outdoor
settings and by Nagao [4] for
understanding
aerial
photographs
bear some similarity
to the
techniques employed here.
A review of these and other related
work in image interpretation
appears in [l].
interpretation
system
which
utilizes
world
We
present
an
knowledge
in the form of simple object hypothesis
rules, and
more complex
interpretation
strategies
attached
to object and
scene schemata, to reduce the ambiguities in image measurements.
These rules involve sets of partiahy
redundant
features each of
which defines an area of feature space which represents a “vote”
for an object.
Convergent
evidence from multiple interpretation
strategies
is organized
by top-down
control mechanisms
in the
context of a partial interpretation.
One such strategy extends a
kernel
interpretation
derived
through
the selection
of object
exemplars,
which
represent
the most reliable
image
specific
hypotheses of a general object class, resuhing in the extension of
partial interpretations
from islands of reliability.
2. A
owledge Network and &?pre.wmatiQnu
Description
of scenes,
at various
levels of detail,
are
captured in a set of schema hierarchies (31. A schema graph is an
organizational
structure defining an expected collection of objects,
such as a house scene, the expected visual attributes
associated
with the objects in the schema (each of which can have an
associated schema), and the expected relations among them. For
exampIe, a house (in a house scene hierarchy) has roof and house
wall as subparts,
and the house wall has windows, shutten,
and
doors as subparts.
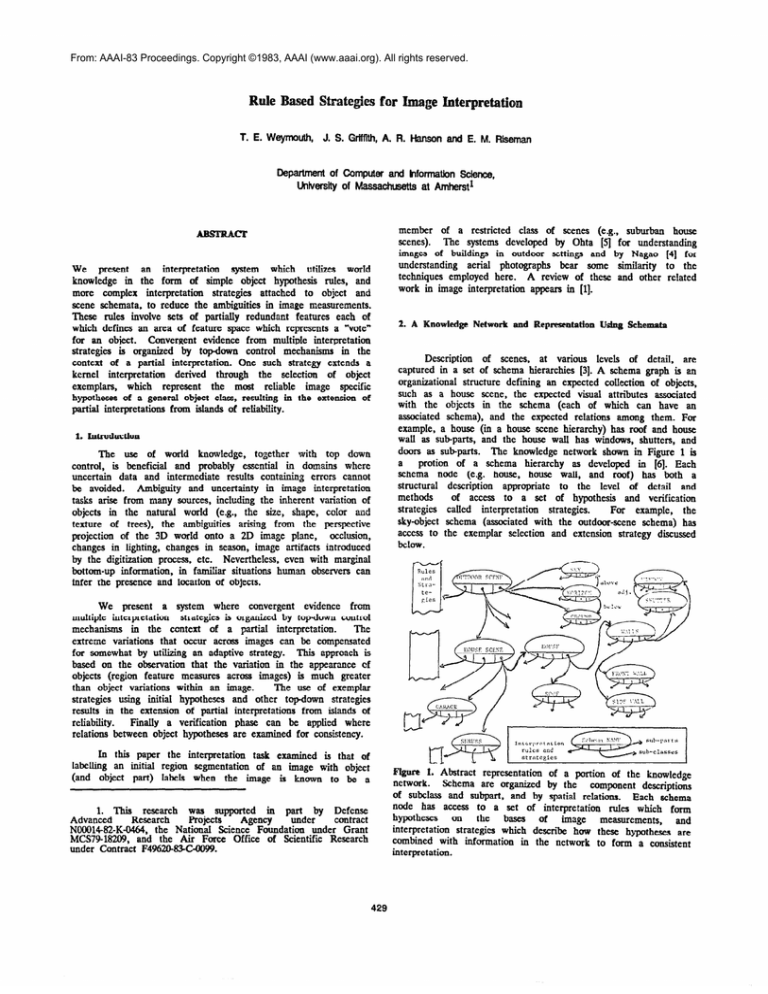
The knowledge network shown in Figure 1 is
a
protion of a schema hierarchy
as developed
in [6]. Each
schema
node (e.g. house, house wall, and roof) has both a
structural
description
appropriate
to the level of detail
and
methods
of access to a set of hypothesis
and verification
strategies
called
interpretation
strategies.
For example,
the
sky-object schema (associated with the outdoor-scene
schema) has
access to the exemplar selection and extension strategy discussed
below.
1. Intmducffon
The use of world
knowledge,
together
with top down
and probably
essential
in domains where
control,
is beneficial
uncertain
data and intermediate
results containing
errors canuot
Ambiguity
and uncertainty
in image interpretation
be avoided.
tasks arise from many sources, including the inherent variation of
objects in the natural
world (e.g., the size, shape, color and
texture
of trees), the ambiguities
arising from the perspective
projection
of the 3D world onto a 2D image plane,
occltion,
changes in lighting, changes in season, image artifacts introduced
Nevertheless,
even with marginal
by the digitization process, etc.
bottom-up information,
in familiar situations human observers can
infer the presence and location of objects.
We present
a system where
convergent
evidence
from
multipIe interpretation
strategies is organized by top-down control
mechanisms
in the context
of a partial
interpretation.
The
extreme variations
that occur across images can be compensated
for somewhat by utilizing an adaptive strategy.
This approach is
based on the observation
that the variation in the appearance
of
objects (region feature measures acre
images) is much greater
than object variations
within an image.
The use of exemplar
strategies
using initial hypotheses
and other top-down
strategies
results in the extension of partial interpretations
from islands of
reliability.
Finally a verification
phase can be applied where
relations between object hypotheses are examined for consistency.
In this paper the interpretation
task examined
is that of
labehg
an initial region segmentation
of an image with object
(and object part) labels when the image is known to be a
al
-
I
1
@ure
1: Abstract
representation
of a portion of the knowledge
network.
Schema are organized by the
component
descriptions
of subchtss and subpart, and by spatial relations.
Each schema
node has access to a set of interpretation
rules which form
hypotheses
on
the
bases
of
image
measurements,
and
interpretation
strategies which describe how these hypotheses
are
combined with information
in the network to form a consistent
interpretation.
1. TnisRcz;;h
was. supported in pgderby
Defense
Advanced
pro)ectS
contract
Agency
NOM-82-K-0464,
the National Science Foundation
under Grant
MCS79-18209, and the Air Force Office of Scientific Research
under Contract F4%2@83GUO99.
429
Let d(fp,fl) be the distance
point fp and the measured feature
the rule is then
Interpretation
rules relate image events to knowledge events
by providing evidence for or against part/subpart
hypotheses.
An
interpretation
strategy, associated with a schema node, specifies in
procedura1 form how specific interpretation
rules may be applied,
and how combined
results from multiple rules may be used to
decide whether
or not to “accept”
(i.e., instantiate)
an object
hypothesis. An interpretation
strategy thus represents both control
IocaI to the node and top-down
control over the instantiation
process.
1
1
WI)
=I
Note that the goal is not to have these interpretation
rules
and strategies
extract
exactly the correct
set of regions. Our
philosophy is to allow incorrect,
but reasonable, hypotheses to be
made and to bring to bear other knowledge
(such as various
similarity measures and spatial constraints)
to fiber the incorrect
hypotheses. An example of such error detection and correction in
the interpretation
process wilI be given in Section 5.
s,
between the prototype feature
value El. The response R of
if
- d(fpfl)
@2 - 91
0
-00
d(fpsQ
s e1
if C!I1 < d(fl,fI)
s @2
if 92 < d(fpfI)
s
if %
e3
< d(fpf1)
The thresholds
631,@+2, and @2 represent
a gross mapping
from the feature
space to a score value that provides
an
interpretation
of the distance
measurements.
633 aknvs strong
negative votes if the measured
feature
value impries that the
hypothesized
object
cannot
be correct.
For example,
fairly
negative values of the excess green feature imply a color which
should veto the grass IabeI.
Thus, certain
measurements
can
exclude
object
labels;
this proves
to be a very
effective
mechanism
for filtering many spurious weak responses. Of course
there is the danger of excIuding the proper label due to a singIe
feature
value, even in the face of strong support from many
other features. In the actual implementation
of this rule form, @I,
3. Role Form for Object Hypotheses Under Uncerta!nty
We wiII illustrate the form of a simpIe interpretation
rule
based on using the expectation
that grass is green.
The feature
used is average
“excess green”
for the region,
obtained
by
computing
the mean of 2G-R-B for all pixels in this region.
Histograms
of this feature are shown in Figure 2, comparing all
regions to alI known grass regions across 8 samples of color
outdoor scenes.
An abstract version is shown in Figure 3. The
basic idea is to form a mapping from a measured value of the
feature obtained from an image region, say fl, into a “vote” for
the object on the basis of this singIe feature.
One approach to
defining this mapping is based on the notion of prototype vectors
and the distance from a given measurement
to the
prototype,
a
welLknown
pattern
classification
technique
which
extends
to
N-dimensional
feature space [3]. In our case rather than using
this distance to “cIassify” objects in a pure Bayesian approach that
is replete with difficulties, we translate it into a “vote”.
@32, and 632 are replaced with six values so that non-symmetric
rules may be defined as shown in Figure 4.
There are many
possibilities for combining the individual feature responses into a
score; here we have used a simple weighted average.
all objects and
Structure
of a simpIe rule for mapping
an image
Fe=
3.
feature measurement
El into support for a label hypothesis on the
basis of a prototype
feature value obtained from the combined
histograms
of labeled regions across image sampIes.
The object
specific mapping is parameterixed
by four values, fp, 631, 0.2, C93,
and stored in the knowledge network.
The use of six vahes wiIl
alIow an asymmetric response function.
F&ure 2. Image histograms of an “excess green” feature (26-R-B)
computed
across eight sampIe images.
The unshaded
histogram
represents
the global distribution
of the feature.
The darkest
cross hatched histogram
is the distribution
of this feature across
regions known to be grass (from a hand labeling of the images)
in one of three specific images.
The intermediate
cross hatching
represents all known grass regions across the entire sample.
Note
the shifting (with respect to the fulI histogram) of the histograms
for the individual images.
Figon
structure,
430
4.
An example
grass rule, showing
an asymmetrical
superimposed
on the histogram of Figure 2,
4.~eu4ks
The advantages
and Islands olRd!abtllty
The extreme
compensated
for
Variation
in the
across images) is
image (see Figure
of using object exemplars
include:
1) an effective means for extending
ml&able hypotheses to
regions which are more ambiguous;
this is similar to the
[2];
notion of “bilands ot realbulty~
variations
that occur across images can be
somewhat
by utilizing
an adaptive
strategy.
appearance
of objects (region feature measures
much greater than object variations
within an
2).
ted technique
for partially dealing with
2) a know!
the unavoidable
region fragmentation
that occurs with any
segmentation
algorithm
or
low-Ievel
image
transformation/grouping;
regions that are “similar* to the
exemplar can be both labelled and merged;
In the initial
stages,
there
are few if any image
hypotheses,
and development
of a partial interpretation
must rely
primarily on general knowIedge of expected object characteristics
in the image and not on the relationship
to other hypotheses.
The
most
reIiabIe
object
hypotheses,
derived
from
the
interpretation
rules, can be considered
object “exemplars”
and
form basis of adaptation.
One strategy
extends
the kernel
interpretation
by using the features of IabeIIed exemplar regions
including color, texture, shape, size, image location, and reIative
location to other objects.
This is similar to the method in [4],
where
“characteristic
regions”
were used to guide hypothesis
formation
in the early stages of interpretation.
The exemptar
region (or set of regions) forms an image-specific
Pototype
which can be used with a similarity measure to select and Label
other regions of the same identity.
A verification
phase can be
applied where relations between object hypotheses
are examined
for consistency.
Thus, the interpretation
is extended
through
matching
and processing
of region
characteristics
as weIl as
semantic inference.
3) exemplars play a natural role in the implementation
of
an hypothesbz+and-verify
eontml
strategy;
hypotheses
are
formed
based
upon
initial
feature
information
and
subsequently
can be used in a verification process where the
relationship
between
Labelled regions provides
consistency
checks on the hypotheses and the evolving interpretation.
5. R&t5
0e RuIe Based Image hterpretattoa
Experiments
are being conducted
on a set of eight “house
scene” images.
Thus far, we have been able to extract
sky,
grass, and foliage (trees and bushes) from five house images with
reasonabIe
effectiveness,
and have been successful in identifying
houses and their parts, including shutters (or windows), house wail
and roof in three of these images. The interpretation
strategies
use many redundant
features, each of which can very often be
expected
to be present. The premise is that many redundant
features
allow any single feature
to be unreliable.
Object
hypothesis rules were employed as described in previous sections,
while object verification
rules requiring
consistent
relationships
with other object labels are under current development.
The final
results shown in Figure 6 are an interpretation
based on coarse
segmentations.
Further
work on segmentation
is being carried
out, as is the refinement
of the exemplar selection and matching
rules (that were shown in section 3).
Exemplars
can be used more generally
than we have
presented them here.
For example a house walI showing through
foliage can be matched to the unoccluded
visibIe portion based
COIor similarity
and
spatial
constraints
derived
from
UP
inferences
of house wall geometry.
The shape and/or sixe of a
region can be used to detect other instances of multiple objects,
as in the case of finding one shutter or window of a house, one
tire of a car, or one car on a road.
Additional
spatial and
perspective constraints can also be employed in object recognition.
An extremely
important
capability
for an interpretation
system is feedback
to lower level processes
for a variety of
The
interpretation
processes
should
have
Purposes.
focus-of-attention
mechanisms
for
correction
of segmentation
Exemplar
hypothesis
rules differ from general
hypothesis
rules in that they are more conservative;
they should minimize
the number of EaIse hypotheses at the risk of missing true target
If all
regions by narrowiug
their range of acceptable
responses.
regions are vetoed, secondary strategies are invoked; for example,
the veto ranges can be relaxed, admitting less reliable exemplars.
Figure 5 compares the rest&s of the grass exemplar ruIe with
The strategy can also be
the genera1 grass hypothesis rule.
used to generate
lists of hypotheses ordered by reliabiity.
The labeling
is:
SKY
GRASS
FOLIAGE
J’he exemplar hypothesis rule is more selective than
ngnn
5.
the corresponding
general
interpretation
rule (based on a less
the general
grass
Figure
Sa shows
selective
rule
form).
rule.
interpretation
ruIe, while Figure Sb shows the exemplar
Note that the general form of the ruIe rest&s in more inCorrect
region hypothesis (which could be filtered by constraints from the
Although
the examplar
rule misses some
knowledge
network).
grass regions, those found have high confidence.
HOUSE
WALL
HOUSE
ROOF
S~R/wINDOW
6.
Example interpretations
for three house scene images.
431
UNLABELED
cl
errors,
extraction
of finer
image
detail,
and verification
of
An example
of the effectiveness
of
semantic
hypotheses.
semantically
directed feedback to segmentation
processes is shown
in Figure 7. There is a key missing boundary between the house
walI and sky which leads to incorrect
object hypotheses
based
The region is hypothesized
upon local interpretation
strategies.
to be sky by the sky strategy, while appIication of the house wall
strategy (using the roof and shutters as spatial constraints
on the
location of house wall) leads to a waII hypothesis.
In these
strategies
the
regions)
for
hypothesis
extension.
knowledge network is examined for objects that can be inferred
from identified objects, and for reIations that would differentiate
can be differentiated
from
them. For example, the bush regions
other foliage
based on their spatiaI relations to the house, and
front and side house walls can be differentiated
using geometric
knowledge
of house structure
(e.g., relations between roof and
In the fuII system, these rules
walls), as shown in Figure 9.
would not work in isolation as shown here, and the errors made
by this type of rule would be filtered by other constraints.
There is evidence avaiIabIe that some form of error has
occurred
in this example:
1) conflicting
labels are produced
for
the same region by Iocal interpretation
strategies;
2) the house
wail label is associated
with regions above the roof (note that
while there are houses with a wall above a lower roof, the
geometric consistency
of the object shape is not satisfied in this
example); and 3) the sky extends down close to the approximate
horizon line in only a portion of the image (which is possible, but
worthy of closer inspection).
Future
work
is directed
towards
refinement
of the
object
segmentation
algorithms,
object
hypothesis
rules,
verification
ruIes, and interpretation
strategies. System deveIopment
is aimed towards
more robust methods
of control:
automatic
schema and strategy selection, interpretation
of images under more
than one genera1 class of schemata,
and automatic
focus of
attention
mechanisms
and error-correcting
strategies for resolving
interpretation
errors.
In this case resegmentation
of the sky-housewall region, with
segmentation
parameters
set to extract finer detail, produces the
results shown in Figure 7a.
Subsequent
remerging
of similar
regions produces a usable segmentation
of this region as shown in
7b.
It should be pointed out that
in this image there is a
discemabIe
boundary
between the sky and house wall.
Initially,
the segmentation
parameters
may be set so that the initial
segmentation
misses this boundary.
This may occur because of
computational
requirements
(fast, coarse segmentations)
or as an
explicit control strategy.
However,
once it is resegmented
with
an intent of overfragmentation,
this boundary
can be detected.
Remerging
based on region means and variances
of a set of
features
alIows much of the overfragmentation
to be removed.
Now, the same interpretation
strategy used eariler produces quite
acceptable results shown in Figure 8.
[l]
[2]
[3]
[4]
[5j
The current development
of interpretation
strategies
the utihxation of stored knowIedge and a partial model
involves
(IabeIIed
[6]
II
I
Binford,
T.,
“Survey
of Model
Based
Image
A.naIysis
Systems,” International Journal of Robotics Research, Volume
1, Number 1, Spring 1982, pp. 18-64.
Erman, L., HayesRoth,
F., Lesser, V. and Reddy, D., “The
Hearsay-B
Speech-Understanding
System:
Integrating
Computing Surveys,
Knowledge
to Resolve
Wncertainty,”
l2(2), June 1980, pp. 2l3-253.
Hanson, A. and Riseman, E., “VISIONS: A Computer System
for Interpreting
Scenes,” in Computer Vision Systems (A.
Hanson and E. Riseman, eds.), Academic
Press, 1978, pp.
303333.
Nagao,
M. and Matsuyama,
T., A Structuruf Analysis of
Complex Aerial Photographs, PIenum Press, New York, 1980.
Ohta,
Y., “A Region-Oriented
System by
Image-AnaIysis
Computer,”
Ph.D. Thesis, Kyoto University,
Department
of
Information
Science, Kyoto, Japan, 1980.
Parma, C., Hanson,
A. and Riseman,
E., “Experiments
in
Schema-Driven
interpretation
of a NaturaI Scene,” COINS
Technical Report number 8@10, University of Massachusetts,
1980. Also in Nate Advanced Study Institute on Digital Image
Processing
(R. Haralick
and J.C. Simon,
eds.), Bonas,
France, 1980.
t(a )
Resegmentation
of house/sky region from Figure 6c.
Ftgan
7.
Figure 7a is the original segmentation
showing the region to be
resegmentated;
7b shows the regions resulting from the selective
application
to the segmentation
process to the cross-hatched
area
in 7a.
Flgura
8. Final interpretation
of the house scene in Figure
,6c, after inserting resegmented
houes/sky
regions
and
reinterpreting
the image.
iPQmre 9. An example
extend region labeling.
and shrub (in 9a) and
used
(in 9b) are
interpretation
shown
ambiguities
(the shrub
Iabeled as house wall)
432
of the use of spatial relations to filter and
The geometric
relations between house
between between roof and house front wall
hypotheses
from
the
region
to refine
in Figure
6c. Note that there
are stiIl
label in the grass area, and the pants
that require the use of other filters.


