Relative information content of the Advanced Technology Microwave Sounder,
advertisement

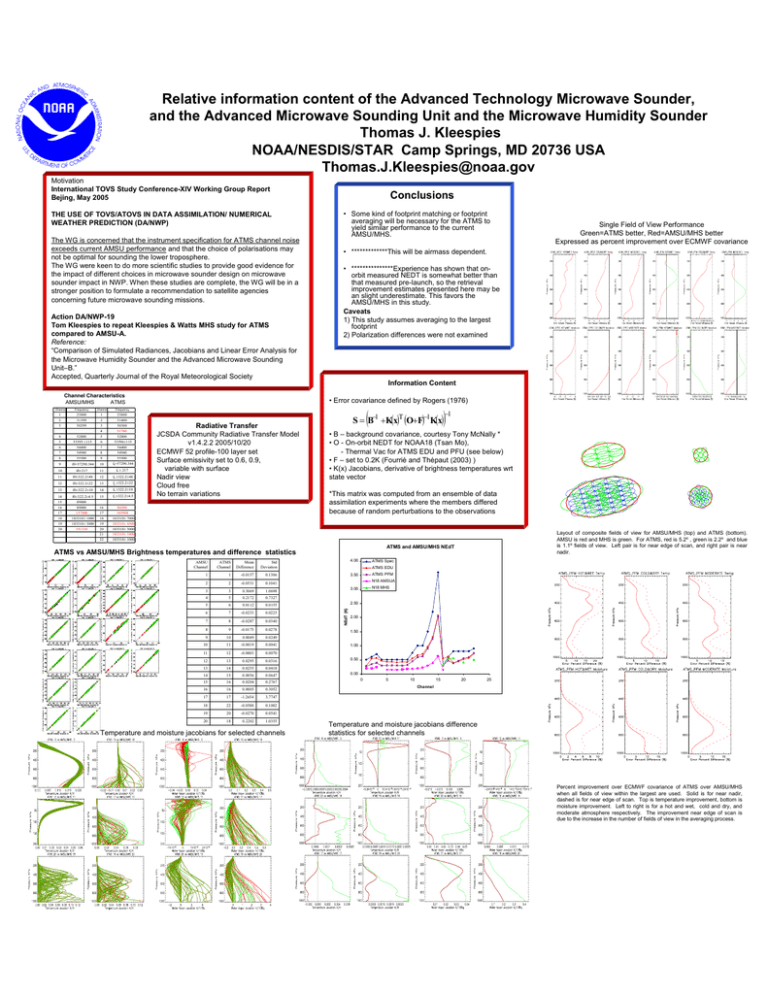
Relative information content of the Advanced Technology Microwave Sounder, and the Advanced Microwave Sounding Unit and the Microwave Humidity Sounder Thomas J. Kleespies NOAA/NESDIS/STAR Camp Springs, MD 20736 USA Thomas.J.Kleespies@noaa.gov Motivation International TOVS Study Conference-XIV Working Group Report Bejing, May 2005 THE USE OF TOVS/ATOVS IN DATA ASSIMILATION/ NUMERICAL WEATHER PREDICTION (DA/NWP) The WG is concerned that the instrument specification for ATMS channel noise exceeds current AMSU performance and that the choice of polarisations may not be optimal for sounding the lower troposphere. The WG were keen to do more scientific studies to provide good evidence for the impact of different choices in microwave sounder design on microwave sounder impact in NWP. When these studies are complete, the WG will be in a stronger position to formulate a recommendation to satellite agencies concerning future microwave sounding missions. Action DA/NWP-19 Tom Kleespies to repeat Kleespies & Watts MHS study for ATMS compared to AMSU-A. Reference: “Comparison of Simulated Radiances, Jacobians and Linear Error Analysis for the Microwave Humidity Sounder and the Advanced Microwave Sounding Unit–B.” Accepted, Quarterly Journal of the Royal Meteorological Society Conclusions • Some kind of footprint matching or footprint averaging will be necessary for the ATMS to yield similar performance to the current AMSU/MHS. Single Field of View Performance Green=ATMS better, Red=AMSU/MHS better Expressed as percent improvement over ECMWF covariance • *************This will be airmass dependent. • ***************Experience has shown that onorbit measured NEDT is somewhat better than that measured pre-launch, so the retrieval improvement estimates presented here may be an slight underestimate. This favors the AMSU/MHS in this study. Caveats 1) This study assumes averaging to the largest footprint 2) Polarization differences were not examined Information Content Channel Characteristics AMSU/MHS ATMS Channel Frequency 1 2 3 23800 31399 50299 4 5 6 7 8 52800 53595 ±115 54400 54940 55500 9 f0=57290.344 Channel • Error covariance defined by Rogers (1976) ( Frequency 1 2 3 4 5 6 7 8 9 23800 31400 50300 51760 52800 53596±115 54400 54940 55500 10 fo=57290.344 10 f0±217 11 fo ± 217 11 f0±322.2±48 12 fo ±322.2±48 12 f0±322.2±22 13 fo ±322.2±22 13 f0±322.2±10 14 fo ±322.2±10 14 15 16 17 18 19 20 f0±322.2±4.5 89000 89000 157000 183310± 1000 183310± 3000 191310 15 fo ±322.2±4.5 16 17 18 19 20 21 22 88200 165500 183310± 7000 183310± 4500 183310± 3000 183310± 1800 183310± 1000 Radiative Transfer JCSDA Community Radiative Transfer Model v1.4.2.2 2005/10/20 ECMWF 52 profile-100 layer set Surface emissivity set to 0.6, 0.9, variable with surface Nadir view Cloud free No terrain variations ) S = B−1 +K(x)T (O+F)−1K(x) −1 • B – background covariance, courtesy Tony McNally * • O - On-orbit NEDT for NOAA18 (Tsan Mo), - Thermal Vac for ATMS EDU and PFU (see below) • F – set to 0.2K (Fourrié and Thépaut (2003) ) • K(x) Jacobians, derivative of brightness temperatures wrt state vector *This matrix was computed from an ensemble of data assimilation experiments where the members differed because of random perturbations to the observations Layout of composite fields of view for AMSU/MHS (top) and ATMS (bottom). AMSU is red and MHS is green. For ATMS, red is 5.2º , green is 2.2º and blue is 1.1º fields of view. Left pair is for near edge of scan, and right pair is near nadir. ATMS and AMSU/MHS NEdT ATMS vs AMSU/MHS Brightness temperatures and difference statistics AMSU Channel ATMS Channel Mean Difference Std Deviation 4.00 1 1 -0.0157 0.1306 3.50 2 2 -0.0531 0.1041 3 0.3069 1.0698 4 5 0.2172 0.7327 5 6 0.0112 0.0155 6 7 -0.0233 0.0225 7 8 -0.0287 0.0340 8 9 -0.0175 0.0278 9 10 0.0049 0.0249 10 11 -0.0019 0.0041 11 12 -0.0003 0.0070 12 13 0.0295 0.0316 13 14 0.0255 0.0418 14 15 0.0056 0.0647 15 16 0.0204 0.2767 16 16 0.0005 0.3052 17 17 -1.2654 3.7747 18 22 -0.0588 0.1002 19 20 -0.0270 0.0541 20 18 0.2202 1.0355 Temperature and moisture jacobians for selected channels ATMS EDU ATMS PFM N18 AMSUA N18 MHS 3.00 2.50 NEdT (K) 3 ATMS Spec 2.00 1.50 1.00 0.50 0.00 0 5 10 15 20 25 Channel Temperature and moisture jacobians difference statistics for selected channels Percent improvement over ECMWF covariance of ATMS over AMSU/MHS when all fields of view within the largest are used. Solid is for near nadir, dashed is for near edge of scan. Top is temperature improvement, bottom is moisture improvement. Left to right is for a hot and wet, cold and dry, and moderate atmosphere respectively. The improvement near edge of scan is due to the increase in the number of fields of view in the averaging process.


