Resolving Tropical Storm Inner Core Temperatures with a Three-Meter Geostationary Scanning
advertisement

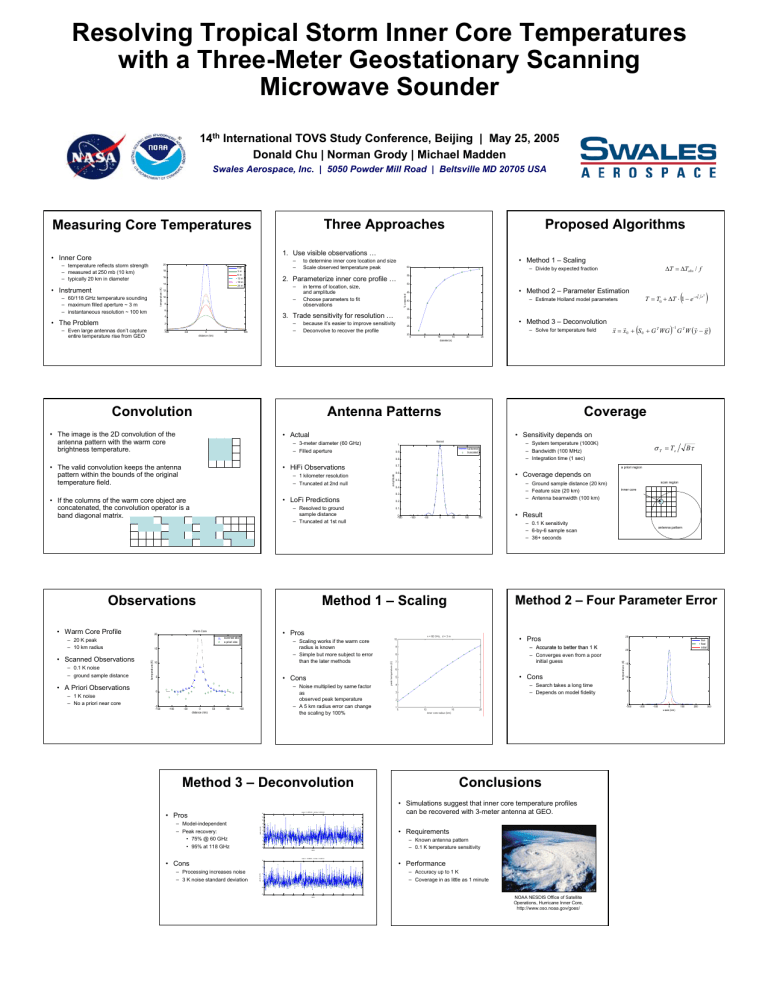
Resolving Tropical Storm Inner Core Temperatures with a Three-Meter Geostationary Scanning Microwave Sounder 14th International TOVS Study Conference, Beijing | May 25, 2005 Donald Chu | Norman Grody | Michael Madden Swales Aerospace, Inc. | 5050 Powder Mill Road | Beltsville MD 20705 USA Three Approaches Measuring Core Temperatures Proposed Algorithms 1. Use visible observations … • Inner Core – – 20 true 3m 6m 12 m 18 m 24 m 18 16 14 – 60/118 GHz temperature sounding – maximum filled aperture ~ 3 m – instantaneous resolution ~ 100 km 60 2. Parameterize inner core profile … – 12 10 – 8 50 in terms of location, size, and amplitude Choose parameters to fit observations 3. Trade sensitivity for resolution … 4 – – 2 – Even large antennas don’t capture entire temperature rise from GEO 45 • Method 2 – Parameter Estimation 40 – Estimate Holland model parameters 0 -100 -50 0 distance (km) 50 100 30 because it’s easier to improve sensitivity Deconvolve to recover the profile • Method 3 – Deconvolution 25 – Solve for temperature field 20 Convolution 0 5 10 15 diameter(m) 20 • Actual • HiFi Observations full kernel truncated 0.7 amplitude – 1 kilometer resolution – Truncated at 2nd null • LoFi Predictions • If the columns of the warm core object are concatenated, the convolution operator is a band diagonal matrix. Observations – Ground sample distance (20 km) – Feature size (20 km) – Antenna beamwidth (100 km) 0.4 scanned obs a priori obs temperature(K) 10 0 -150 -100 -50 0 50 100 150 -50 0 distance (km) antenna pattern Method 2 – Four Parameter Error 50 100 150 – Accurate to better than 1 K – Converges even from a poor initial guess • Cons – Search takes a long time – Depends on model fidelity Conclusions • Simulations suggest that inner core temperature profiles can be recovered with 3-meter antenna at GEO. mean = 0.43764 K; std dev = 2.8216 K 14 12 10 – Model-independent – Peak recovery: • 75% @ 60 GHz • 95% at 118 GHz 8 6 • Requirements 4 2 0 -2 -4 -6 0 100 200 300 400 500 cases 600 700 800 900 1000 – Known antenna pattern – 0.1 K temperature sensitivity mean = -4.9909 K; std dev = 3.4061 K 10 • Cons – Processing increases noise – 3 K noise standard deviation • Performance 5 – Accuracy up to 1 K – Coverage in as little as 1 minute 0 -5 -10 -15 0 100 200 300 400 500 cases 600 700 800 900 1000 true final initial 20 15 10 5 0 -300 Method 3 – Deconvolution • Pros 25 • Pros – Noise multiplied by same factor as observed peak temperature – A 5 km radius error can change the scaling by 100% 0 -100 • Result – 0.1 K sensitivity – 6-by-6 sample scan – 36+ seconds • Cons 5 -5 -150 0.1 – Scaling works if the warm core radius is known – Simple but more subject to error than the later methods 15 peak error(K) – 1 K noise – No a priori near core scan region inner core • Pros 20 Bτ • Coverage depends on 0.5 Method 1 – Scaling peak error(K) • A Priori Observations σ T = Ts a priori region 0.6 0.2 – Resolved to ground sample distance – Truncated at 1st null Warm Core −1 G G G G x = x 0 + (S 0 + G T WG ) G T W ( y − g ) – System temperature (1000K) – Bandwidth (100 MHz) – Integration time (1 sec) 1 0.9 0.3 – 0.1 K noise – ground sample distance ) • Sensitivity depends on Kernel – 3-meter diameter (60 GHz) – Filled aperture • The valid convolution keeps the antenna pattern within the bounds of the original temperature field. • Scanned Observations r2 Coverage 0.8 – 20 K peak – 10 km radius 2 25 Antenna Patterns • The image is the 2D convolution of the antenna pattern with the warm core brightness temperature. • Warm Core Profile ( T = T0 + ∆T ⋅ 1 − e − r0 35 6 • The Problem ∆T = ∆Tobs / f – Divide by expected fraction 55 temperature (K) temperature (K) • Instrument • Method 1 – Scaling to determine inner core location and size Scale observed temperature peak % expected – temperature reflects storm strength – measured at 250 mb (10 km) – typically 20 km in diameter NOAA NESDIS Office of Satellite Operations, Hurricane Inner Core, http://www.oso.noaa.gov/goes/ -200 -100 0 x-axis (km) 100 200 300


