Work-Related Injuries — Alaska, 2001–2010
advertisement

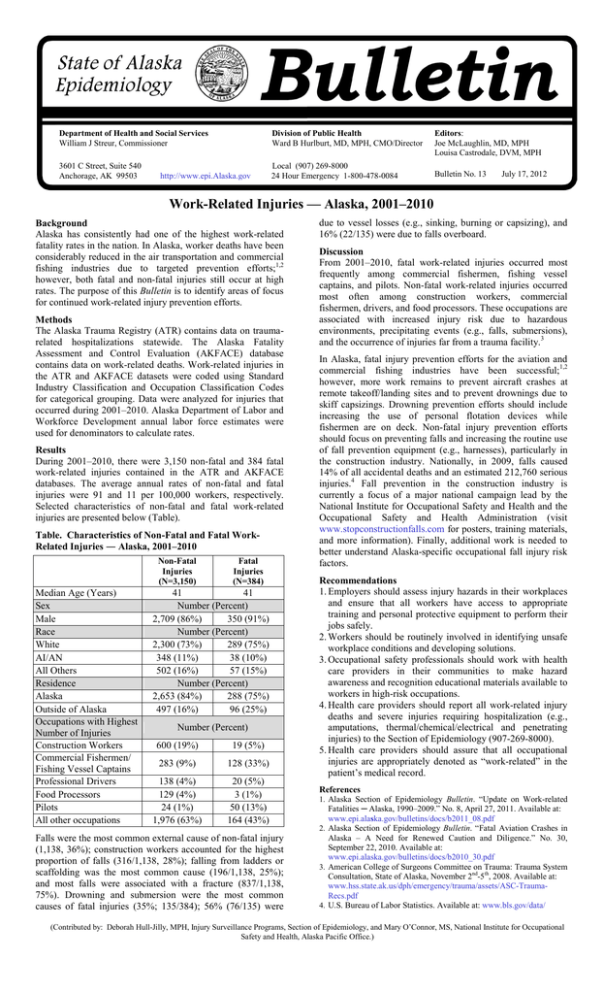
Department of Health and Social Services William J Streur, Commissioner Division of Public Health Ward B Hurlburt, MD, MPH, CMO/Director 3601 C Street, Suite 540 Anchorage, AK 99503 Local (907) 269-8000 24 Hour Emergency 1-800-478-0084 http://www.epi.Alaska.gov Editors: Joe McLaughlin, MD, MPH Louisa Castrodale, DVM, MPH Bulletin No. 13 July 17, 2012 Work-Related Injuries — Alaska, 2001–2010 Background Alaska has consistently had one of the highest work-related fatality rates in the nation. In Alaska, worker deaths have been considerably reduced in the air transportation and commercial fishing industries due to targeted prevention efforts;1,2 however, both fatal and non-fatal injuries still occur at high rates. The purpose of this Bulletin is to identify areas of focus for continued work-related injury prevention efforts. Methods The Alaska Trauma Registry (ATR) contains data on traumarelated hospitalizations statewide. The Alaska Fatality Assessment and Control Evaluation (AKFACE) database contains data on work-related deaths. Work-related injuries in the ATR and AKFACE datasets were coded using Standard Industry Classification and Occupation Classification Codes for categorical grouping. Data were analyzed for injuries that occurred during 2001–2010. Alaska Department of Labor and Workforce Development annual labor force estimates were used for denominators to calculate rates. Results During 2001–2010, there were 3,150 non-fatal and 384 fatal work-related injuries contained in the ATR and AKFACE databases. The average annual rates of non-fatal and fatal injuries were 91 and 11 per 100,000 workers, respectively. Selected characteristics of non-fatal and fatal work-related injuries are presented below (Table). Table. Characteristics of Non-Fatal and Fatal WorkRelated Injuries ― Alaska, 2001–2010 Non-Fatal Injuries (N=3,150) Median Age (Years) Sex Male Race White AI/AN All Others Residence Alaska Outside of Alaska Occupations with Highest Number of Injuries Construction Workers Commercial Fishermen/ Fishing Vessel Captains Professional Drivers Food Processors Pilots All other occupations Fatal Injuries (N=384) 41 41 Number (Percent) 2,709 (86%) 350 (91%) Number (Percent) 2,300 (73%) 289 (75%) 348 (11%) 38 (10%) 502 (16%) 57 (15%) Number (Percent) 2,653 (84%) 288 (75%) 497 (16%) 96 (25%) Number (Percent) 600 (19%) 19 (5%) 283 (9%) 128 (33%) 138 (4%) 129 (4%) 24 (1%) 1,976 (63%) 20 (5%) 3 (1%) 50 (13%) 164 (43%) Falls were the most common external cause of non-fatal injury (1,138, 36%); construction workers accounted for the highest proportion of falls (316/1,138, 28%); falling from ladders or scaffolding was the most common cause (196/1,138, 25%); and most falls were associated with a fracture (837/1,138, 75%). Drowning and submersion were the most common causes of fatal injuries (35%; 135/384); 56% (76/135) were due to vessel losses (e.g., sinking, burning or capsizing), and 16% (22/135) were due to falls overboard. Discussion From 2001–2010, fatal work-related injuries occurred most frequently among commercial fishermen, fishing vessel captains, and pilots. Non-fatal work-related injuries occurred most often among construction workers, commercial fishermen, drivers, and food processors. These occupations are associated with increased injury risk due to hazardous environments, precipitating events (e.g., falls, submersions), and the occurrence of injuries far from a trauma facility.3 In Alaska, fatal injury prevention efforts for the aviation and commercial fishing industries have been successful;1,2 however, more work remains to prevent aircraft crashes at remote takeoff/landing sites and to prevent drownings due to skiff capsizings. Drowning prevention efforts should include increasing the use of personal flotation devices while fishermen are on deck. Non-fatal injury prevention efforts should focus on preventing falls and increasing the routine use of fall prevention equipment (e.g., harnesses), particularly in the construction industry. Nationally, in 2009, falls caused 14% of all accidental deaths and an estimated 212,760 serious injuries.4 Fall prevention in the construction industry is currently a focus of a major national campaign lead by the National Institute for Occupational Safety and Health and the Occupational Safety and Health Administration (visit www.stopconstructionfalls.com for posters, training materials, and more information). Finally, additional work is needed to better understand Alaska-specific occupational fall injury risk factors. Recommendations 1. Employers should assess injury hazards in their workplaces and ensure that all workers have access to appropriate training and personal protective equipment to perform their jobs safely. 2. Workers should be routinely involved in identifying unsafe workplace conditions and developing solutions. 3. Occupational safety professionals should work with health care providers in their communities to make hazard awareness and recognition educational materials available to workers in high-risk occupations. 4. Health care providers should report all work-related injury deaths and severe injuries requiring hospitalization (e.g., amputations, thermal/chemical/electrical and penetrating injuries) to the Section of Epidemiology (907-269-8000). 5. Health care providers should assure that all occupational injuries are appropriately denoted as “work-related” in the patient’s medical record. References 1. Alaska Section of Epidemiology Bulletin. “Update on Work-related Fatalities ─ Alaska, 1990–2009.” No. 8, April 27, 2011. Available at: www.epi.alaska.gov/bulletins/docs/b2011_08.pdf 2. Alaska Section of Epidemiology Bulletin. “Fatal Aviation Crashes in Alaska – A Need for Renewed Caution and Diligence.” No. 30, September 22, 2010. Available at: www.epi.alaska.gov/bulletins/docs/b2010_30.pdf 3. American College of Surgeons Committee on Trauma: Trauma System Consultation, State of Alaska, November 2nd-5th, 2008. Available at: www.hss.state.ak.us/dph/emergency/trauma/assets/ASC-TraumaRecs.pdf 4. U.S. Bureau of Labor Statistics. Available at: www.bls.gov/data/ (Contributed by: Deborah Hull-Jilly, MPH, Injury Surveillance Programs, Section of Epidemiology, and Mary O’Connor, MS, National Institute for Occupational Safety and Health, Alaska Pacific Office.)


