∑
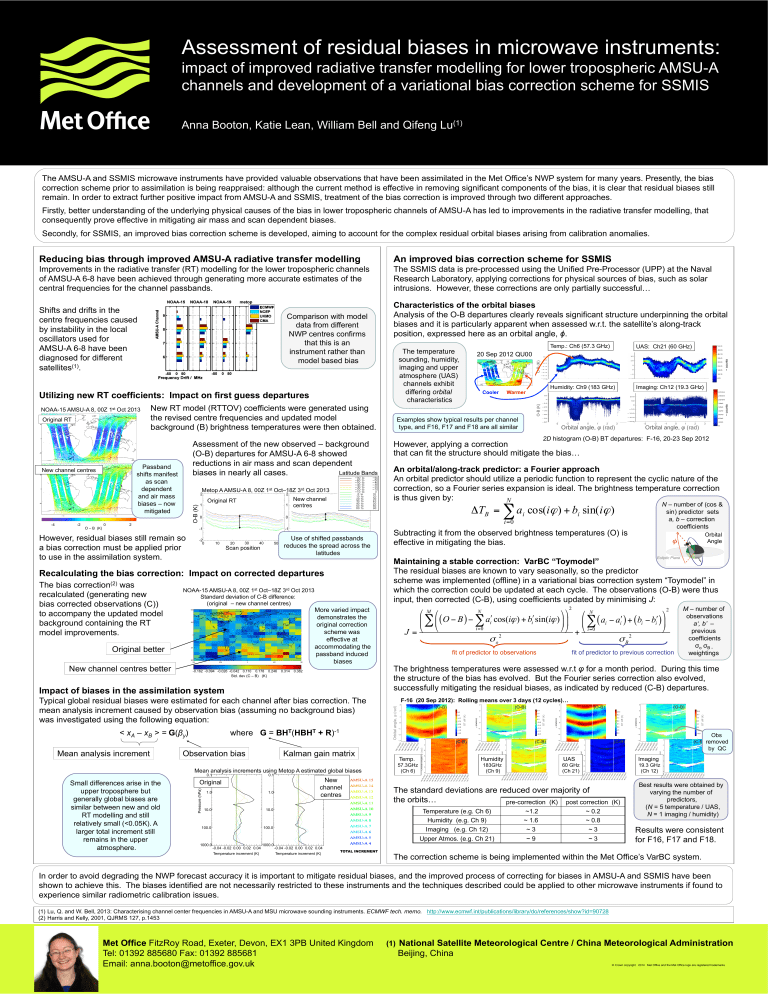
Assessment of residual biases in microwave instruments: impact of improved radiative transfer modelling for lower tropospheric AMSU-A channels and development of a variational bias correction scheme for SSMIS
Anna Booton, Katie Lean, William Bell and Qifeng Lu
(1)
The AMSU-A and SSMIS microwave instruments have provided valuable observations that have been assimilated in the Met Office’s NWP system for many years. Presently, the bias correction scheme prior to assimilation is being reappraised: although the current method is effective in removing significant components of the bias, it is clear that residual biases still remain. In order to extract further positive impact from AMSU-A and SSMIS, treatment of the bias correction is improved through two different approaches.
Firstly, better understanding of the underlying physical causes of the bias in lower tropospheric channels of AMSU-A has led to improvements in the radiative transfer modelling, that consequently prove effective in mitigating air mass and scan dependent biases.
Secondly, for SSMIS, an improved bias correction scheme is developed, aiming to account for the complex residual orbital biases arising from calibration anomalies.
Reducing bias through improved AMSU-A radiative transfer modelling
Improvements in the radiative transfer (RT) modelling for the lower tropospheric channels of AMSU-A 6-8 have been achieved through generating more accurate estimates of the central frequencies for the channel passbands.
Shifts and drifts in the centre frequencies caused by instability in the local oscillators used for
AMSU-A 6-8 have been diagnosed for different satellites (1) .
Comparison with model data from different
NWP centres confirms that this is an instrument rather than model based bias
Utilizing new RT coefficients: Impact on first guess departures
NOAA-15 AMSU-A 8, 00Z 1 st Oct 2013
Original RT
New RT model (RTTOV) coefficients were generated using the revised centre frequencies and updated model background (B) brightness temperatures were then obtained.
New channel centres
Passband shifts manifest as scan dependent and air mass biases – now mitigated
Assessment of the new observed – background
(O-B) departures for AMSU-A 6-8 showed reductions in air mass and scan dependent biases in nearly all cases.
Latitude Bands
1
2
Metop A AMSU-A 8, 00Z 1 st Oct–18Z 3 rd Oct 2013
Original RT
2
New channel
1 centres
0 0
-4 -2
O – B (K)
0 2
However, residual biases still remain so a bias correction must be applied prior to use in the assimilation system.
-1
-2
0 10 20 30 40
Scan position
50
-1
Use of shifted passbands reduces the spread across the latitudes
Recalculating the bias correction: Impact on corrected departures
The bias correction (2) was recalculated (generating new bias corrected observations (C)) to accompany the updated model background containing the RT model improvements.
Original better
New channel centres better
NOAA-15 AMSU-A 8, 00Z 1 st Oct–18Z 3 rd Oct 2013
Standard deviation of C-B difference:
(original – new channel centres)
More varied impact demonstrates the original correction scheme was effective at accommodating the passband induced biases
-0.162 -0.094 -0.026 -0.042 0.110 0.178 0.246 0.314 0.382
Std. dev (C – B) (K)
Impact of biases in the assimilation system
Typical global residual biases were estimated for each channel after bias correction. The mean analysis increment caused by observation bias (assuming no background bias) was investigated using the following equation:
< x
A
– x
B
> =
G
(
β
y
) where
G
=
BH
T (
HBH
T
+ R
) -1
An improved bias correction scheme for SSMIS
The SSMIS data is pre-processed using the Unified Pre-Processor (UPP) at the Naval
Research Laboratory, applying corrections for physical sources of bias, such as solar intrusions. However, these corrections are only partially successful…
Characteristics of the orbital biases
Analysis of the O-B departures clearly reveals significant structure underpinning the orbital biases and it is particularly apparent when assessed w.r.t. the satellite’s along-track position, expressed here as an orbital angle,
ϕ
.
Temp.: Ch6 (57.3 GHz) UAS: Ch21 (60 GHz)
The temperature sounding, humidity, imaging and upper atmosphere (UAS) channels exhibit differing orbital characteristics
20 Sep 2012 QU00
Cooler Warmer
Humidity: Ch9 (183 GHz) Imaging: Ch12 (19.3 GHz)
Examples show typical results per channel type, and F16, F17 and F18 are all similar
-3 -2 -1 0 1 2
Orbital angle, φ (rad)
3 -3 -2 -1 0 1 2
Orbital angle, φ (rad)
3
2D histogram (O-B) BT departures: F-16, 20-23 Sep 2012
However, applying a correction that can fit the structure should mitigate the bias…
An orbital/along-track predictor: a Fourier approach
An orbital predictor should utilize a periodic function to represent the cyclic nature of the correction, so a Fourier series expansion is ideal. The brightness temperature correction is thus given by:
N
Δ
T
B
= i
∑
= 0 a i cos( i ϕ ) + b i sin( i ϕ )
Subtracting it from the observed brightness temperatures (O) is effective in mitigating the bias.
N – number of (cos & sin) predictor sets a, b – correction coefficients
φ
Orbital
Angle
Maintaining a stable correction: VarBC “Toymodel”
Ecliptic Plane
The residual biases are known to vary seasonally, so the predictor scheme was implemented (offline) in a variational bias correction system “Toymodel” in which the correction could be updated at each cycle. The observations (O-B) were thus input, then corrected (C-B), using coefficients updated by minimising J :
J =
⎜
⎛
⎝
M
∑
⎜
⎛
⎝
( O B ) −
N i
∑
= 0 a ʹ′ i i
ϕ
+ b ʹ′ i i
ϕ
σ
o
2 fit of predictor to observations
⎠
⎞
2
⎞ ⎛
⎟ ⎟ ⎜
⎠
+
⎝
N i
∑
= 0
( a i
− a ʹ′ i
) ( i
− ʹ′ i
)
⎟
⎞
⎠
2
2
σ
B fit of predictor to previous correction
M – number of observations a‘, b’ – previous coefficients
σ o
σ
B - weightings
The brightness temperatures were assessed w.r.t
φ
for a month period. During this time the structure of the bias has evolved. But the Fourier series correction also evolved, successfully mitigating the residual biases, as indicated by reduced (C-B) departures.
F-16 (20 Sep 2012): Rolling means over 3 days (12 cycles)…
(O-B) (O-B) (O-B) (O-B)
Mean analysis increment
Small differences arise in the upper troposphere but generally global biases are similar between new and old
RT modelling and still relatively small (<0.05K). A larger total increment still remains in the upper atmosphere.
Observation bias
10.0
Kalman gain matrix
Mean analysis increments using Metop A estimated global biases
0.1
Original
0.1
New channel
1.0 1.0 centres
10.0
100.0 100.0
1000.0
-0.04 -0.02 0.00 0.02 0.04
1000.0
-0.04 -0.02 0.00 0.02 0.04
Temperature increment (K) Temperature increment (K)
TOTAL INCREMENT
Temp.
57.3GHz
(Ch 6)
(C-B)
Humidity
183GHz
(Ch 9)
(C-B)
UAS
60 GHz
(Ch 21)
The standard deviations are reduced over majority of the orbits…
pre-correction (K) post correction (K)
Temperature (e.g. Ch 6)
Humidity (e.g. Ch 9)
Imaging (e.g. Ch 12)
Upper Atmos. (e.g. Ch 21)
~1.2
~ 1.6
~ 3
~ 9
~ 0.2
~ 0.8
~ 3
~ 3
(C-B)
Obs
(C-B) removed by QC
Imaging
19.3 GHz
(Ch 12)
Best results were obtained by varying the number of predictors,
( N = 5 temperature / UAS,
N = 1 imaging / humidity)
Results were consistent for F16, F17 and F18.
The correction scheme is being implemented within the Met Office’s VarBC system.
In order to avoid degrading the NWP forecast accuracy it is important to mitigate residual biases, and the improved process of correcting for biases in AMSU-A and SSMIS have been shown to achieve this. The biases identified are not necessarily restricted to these instruments and the techniques described could be applied to other microwave instruments if found to experience similar radiometric calibration issues.
(1) Lu, Q. and W. Bell, 2013: Characterising channel center frequencies in AMSU-A and MSU microwave sounding instruments. ECMWF tech. memo. http://www.ecmwf.int/publications/library/do/references/show?id=90728
(2) Harris and Kelly, 2001, QJRMS 127, p.1453
Met Office FitzRoy Road, Exeter, Devon, EX1 3PB United Kingdom
Tel: 01392 885680 Fax: 01392 885681
Email: anna.booton@metoffice.gov.uk
(1)
National Satellite Meteorological Centre / China Meteorological Administration
Beijing, China
© Crown copyright 2014 Met Office and the Met Office logo are registered trademarks

