Assimilating IASI data into the Met Office UKV convective scale model
advertisement

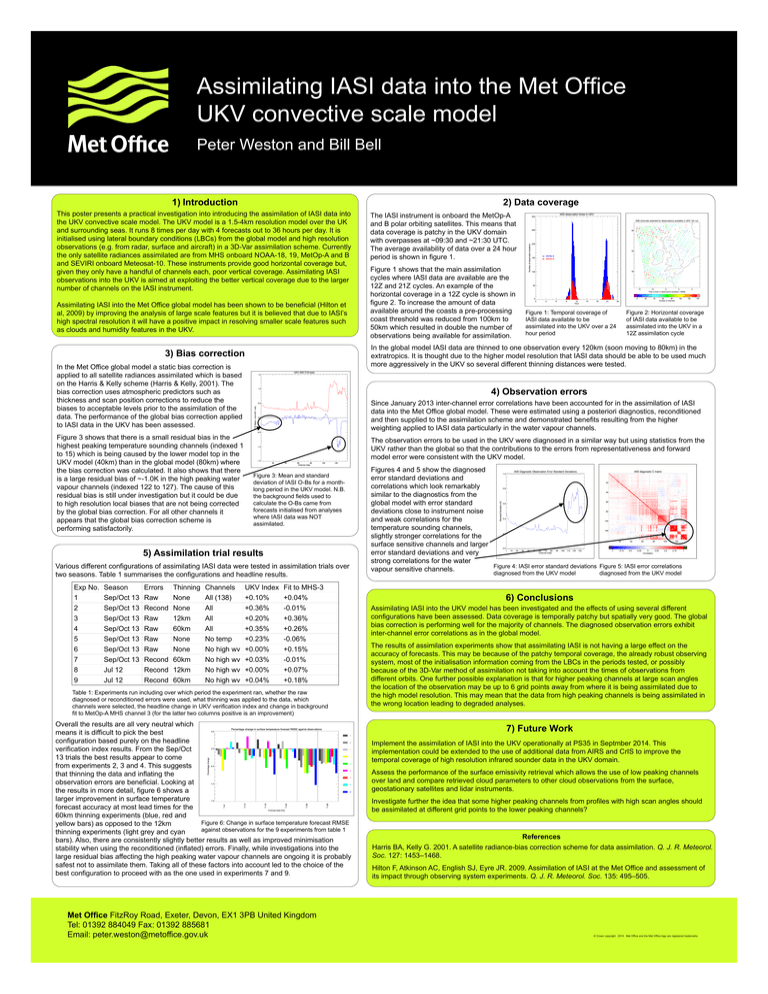
Assimilating IASI data into the Met Office UKV convective scale model Peter Weston and Bill Bell 1) Introduction 2) Data coverage This poster presents a practical investigation into introducing the assimilation of IASI data into the UKV convective scale model. The UKV model is a 1.5-4km resolution model over the UK and surrounding seas. It runs 8 times per day with 4 forecasts out to 36 hours per day. It is initialised using lateral boundary conditions (LBCs) from the global model and high resolution observations (e.g. from radar, surface and aircraft) in a 3D-Var assimilation scheme. Currently the only satellite radiances assimilated are from MHS onboard NOAA-18, 19, MetOp-A and B and SEVIRI onboard Meteosat-10. These instruments provide good horizontal coverage but, given they only have a handful of channels each, poor vertical coverage. Assimilating IASI observations into the UKV is aimed at exploiting the better vertical coverage due to the larger number of channels on the IASI instrument. Assimilating IASI into the Met Office global model has been shown to be beneficial (Hilton et al, 2009) by improving the analysis of large scale features but it is believed that due to IASI’s high spectral resolution it will have a positive impact in resolving smaller scale features such as clouds and humidity features in the UKV. In the Met Office global model a static bias correction is applied to all satellite radiances assimilated which is based on the Harris & Kelly scheme (Harris & Kelly, 2001). The bias correction uses atmospheric predictors such as thickness and scan position corrections to reduce the biases to acceptable levels prior to the assimilation of the data. The performance of the global bias correction applied to IASI data in the UKV has been assessed. Errors Raw Recond Raw Raw Raw Raw Recond Recond Recond Thinning None None 12km 60km None None 60km 12km 60km Channels All (138) All All All No temp No high wv No high wv No high wv No high wv Figure 2: Horizontal coverage of IASI data available to be assimilated into the UKV in a 12Z assimilation cycle Since January 2013 inter-channel error correlations have been accounted for in the assimilation of IASI data into the Met Office global model. These were estimated using a posteriori diagnostics, reconditioned and then supplied to the assimilation scheme and demonstrated benefits resulting from the higher weighting applied to IASI data particularly in the water vapour channels. The observation errors to be used in the UKV were diagnosed in a similar way but using statistics from the UKV rather than the global so that the contributions to the errors from representativeness and forward model error were consistent with the UKV model. Figure 3: Mean and standard deviation of IASI O-Bs for a monthlong period in the UKV model. N.B. the background fields used to calculate the O-Bs came from forecasts initialised from analyses where IASI data was NOT assimilated. Various different configurations of assimilating IASI data were tested in assimilation trials over two seasons. Table 1 summarises the configurations and headline results. Season Sep/Oct 13 Sep/Oct 13 Sep/Oct 13 Sep/Oct 13 Sep/Oct 13 Sep/Oct 13 Sep/Oct 13 Jul 12 Jul 12 Figure 1: Temporal coverage of IASI data available to be assimilated into the UKV over a 24 hour period 4) Observation errors 5) Assimilation trial results Exp No. 1 2 3 4 5 6 7 8 9 Figure 1 shows that the main assimilation cycles where IASI data are available are the 12Z and 21Z cycles. An example of the horizontal coverage in a 12Z cycle is shown in figure 2. To increase the amount of data available around the coasts a pre-processing coast threshold was reduced from 100km to 50km which resulted in double the number of observations being available for assimilation. In the global model IASI data are thinned to one observation every 120km (soon moving to 80km) in the extratropics. It is thought due to the higher model resolution that IASI data should be able to be used much more aggressively in the UKV so several different thinning distances were tested. 3) Bias correction Figure 3 shows that there is a small residual bias in the highest peaking temperature sounding channels (indexed 1 to 15) which is being caused by the lower model top in the UKV model (40km) than in the global model (80km) where the bias correction was calculated. It also shows that there is a large residual bias of ~-1.0K in the high peaking water vapour channels (indexed 122 to 127). The cause of this residual bias is still under investigation but it could be due to high resolution local biases that are not being corrected by the global bias correction. For all other channels it appears that the global bias correction scheme is performing satisfactorily. The IASI instrument is onboard the MetOp-A and B polar orbiting satellites. This means that data coverage is patchy in the UKV domain with overpasses at ~09:30 and ~21:30 UTC. The average availability of data over a 24 hour period is shown in figure 1. UKV Index +0.10% +0.36% +0.20% +0.35% +0.23% +0.00% +0.03% +0.00% +0.04% Fit to MHS-3 +0.04% -0.01% +0.36% +0.26% -0.06% +0.15% -0.01% +0.07% +0.18% Table 1: Experiments run including over which period the experiment ran, whether the raw diagnosed or reconditioned errors were used, what thinning was applied to the data, which channels were selected, the headline change in UKV verification index and change in background fit to MetOp-A MHS channel 3 (for the latter two columns positive is an improvement) Overall the results are all very neutral which means it is difficult to pick the best configuration based purely on the headline verification index results. From the Sep/Oct 13 trials the best results appear to come from experiments 2, 3 and 4. This suggests that thinning the data and inflating the observation errors are beneficial. Looking at the results in more detail, figure 6 shows a larger improvement in surface temperature forecast accuracy at most lead times for the 60km thinning experiments (blue, red and Figure 6: Change in surface temperature forecast RMSE yellow bars) as opposed to the 12km against observations for the 9 experiments from table 1 thinning experiments (light grey and cyan bars). Also, there are consistently slightly better results as well as improved minimisation stability when using the reconditioned (inflated) errors. Finally, while investigations into the large residual bias affecting the high peaking water vapour channels are ongoing it is probably safest not to assimilate them. Taking all of these factors into account led to the choice of the best configuration to proceed with as the one used in experiments 7 and 9. Met Office FitzRoy Road, Exeter, Devon, EX1 3PB United Kingdom Tel: 01392 884049 Fax: 01392 885681 Email: peter.weston@metoffice.gov.uk Figures 4 and 5 show the diagnosed error standard deviations and correlations which look remarkably similar to the diagnostics from the global model with error standard deviations close to instrument noise and weak correlations for the temperature sounding channels, slightly stronger correlations for the surface sensitive channels and larger error standard deviations and very strong correlations for the water Figure 4: IASI error standard deviations Figure 5: IASI error correlations vapour sensitive channels. diagnosed from the UKV model diagnosed from the UKV model 6) Conclusions Assimilating IASI into the UKV model has been investigated and the effects of using several different configurations have been assessed. Data coverage is temporally patchy but spatially very good. The global bias correction is performing well for the majority of channels. The diagnosed observation errors exhibit inter-channel error correlations as in the global model. The results of assimilation experiments show that assimilating IASI is not having a large effect on the accuracy of forecasts. This may be because of the patchy temporal coverage, the already robust observing system, most of the initialisation information coming from the LBCs in the periods tested, or possibly because of the 3D-Var method of assimilation not taking into account the times of observations from different orbits. One further possible explanation is that for higher peaking channels at large scan angles the location of the observation may be up to 6 grid points away from where it is being assimilated due to the high model resolution. This may mean that the data from high peaking channels is being assimilated in the wrong location leading to degraded analyses. 7) Future Work Implement the assimilation of IASI into the UKV operationally at PS35 in Septmber 2014. This implementation could be extended to the use of additional data from AIRS and CrIS to improve the temporal coverage of high resolution infrared sounder data in the UKV domain. Assess the performance of the surface emissivity retrieval which allows the use of low peaking channels over land and compare retrieved cloud parameters to other cloud observations from the surface, geostationary satellites and lidar instruments. Investigate further the idea that some higher peaking channels from profiles with high scan angles should be assimilated at different grid points to the lower peaking channels? References Harris BA, Kelly G. 2001. A satellite radiance-bias correction scheme for data assimilation. Q. J. R. Meteorol. Soc. 127: 1453–1468. Hilton F, Atkinson AC, English SJ, Eyre JR. 2009. Assimilation of IASI at the Met Office and assessment of its impact through observing system experiments. Q. J. R. Meteorol. Soc. 135: 495–505. © Crown copyright 2014 Met Office and the Met Office logo are registered trademarks


