Global Land Cover Resolution
advertisement
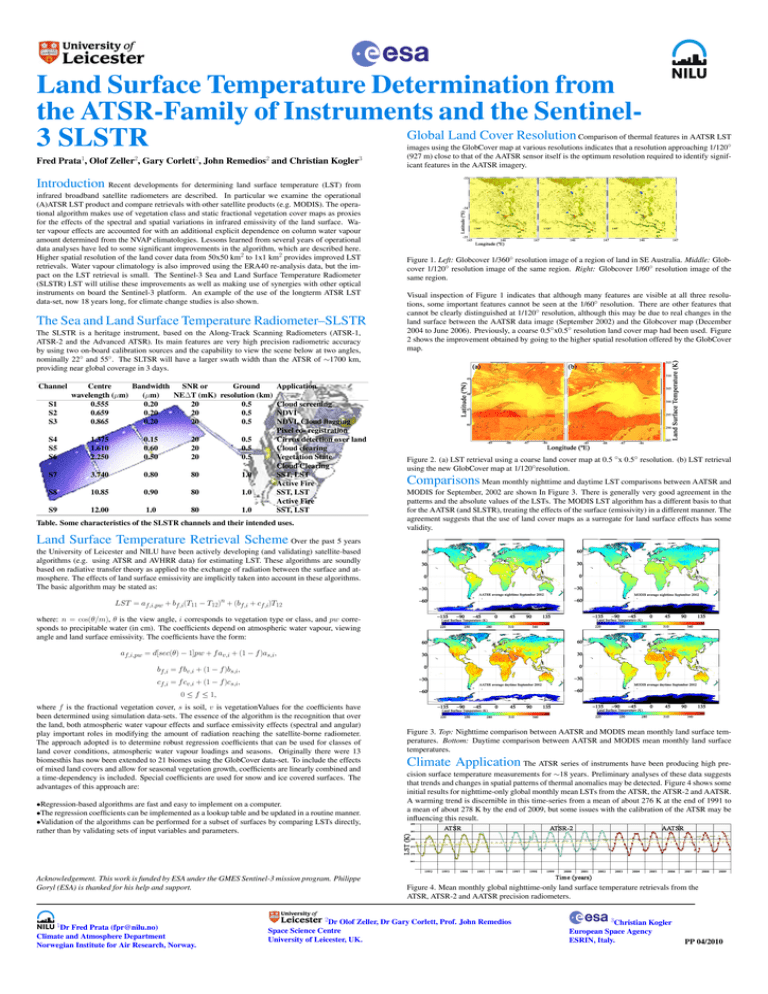
Land Surface Temperature Determination from the ATSR-Family of Instruments and the SentinelGlobal Land Cover Resolution 3 SLSTR Fred Prata1, Olof Zeller2, Gary Corlett2, John Remedios2 and Christian Kogler3 Comparison of thermal features in AATSR LST images using the GlobCover map at various resolutions indicates that a resolution approaching 1/120◦ (927 m) close to that of the AATSR sensor itself is the optimum resolution required to identify significant features in the AATSR imagery. Introduction Recent developments for determining land surface temperature (LST) from infrared broadband satellite radiometers are described. In particular we examine the operational (A)ATSR LST product and compare retrievals with other satellite products (e.g. MODIS). The operational algorithm makes use of vegetation class and static fractional vegetation cover maps as proxies for the effects of the spectral and spatial variations in infrared emissivity of the land surface. Water vapour effects are accounted for with an additional explicit dependence on column water vapour amount determined from the NVAP climatologies. Lessons learned from several years of operational data analyses have led to some significant improvements in the algorithm, which are described here. Higher spatial resolution of the land cover data from 50x50 km2 to 1x1 km2 provides improved LST retrievals. Water vapour climatology is also improved using the ERA40 re-analysis data, but the impact on the LST retrieval is small. The Sentinel-3 Sea and Land Surface Temperature Radiometer (SLSTR) LST will utilise these improvements as well as making use of synergies with other optical instruments on board the Sentinel-3 platform. An example of the use of the longterm ATSR LST data-set, now 18 years long, for climate change studies is also shown. The Sea and Land Surface Temperature Radiometer–SLSTR The SLSTR is a heritage instrument, based on the Along-Track Scanning Radiometers (ATSR-1, ATSR-2 and the Advanced ATSR). Its main features are very high precision radiometric accuracy by using two on-board calibration sources and the capability to view the scene below at two angles, nominally 22◦ and 55◦. The SLTSR will have a larger swath width than the ATSR of ∼1700 km, providing near global coverage in 3 days. Channel S1 S2 S3 Centre Bandwidth SNR or Ground wavelength (µm) (µm) NE∆T (mK) resolution (km) 0.555 0.20 20 0.5 0.659 0.20 20 0.5 0.865 0.20 20 0.5 S4 S5 S6 1.375 1.610 2.250 0.15 0.60 0.50 20 20 20 0.5 0.5 0.5 S7 3.740 0.80 80 1.0 S8 10.85 0.90 80 1.0 S9 12.00 1.0 80 1.0 Figure 1. Left: Globcover 1/360◦ resolution image of a region of land in SE Australia. Middle: Globcover 1/120◦ resolution image of the same region. Right: Globcover 1/60◦ resolution image of the same region. Visual inspection of Figure 1 indicates that although many features are visible at all three resolutions, some important features cannot be seen at the 1/60◦ resolution. There are other features that cannot be clearly distinguished at 1/120◦ resolution, although this may be due to real changes in the land surface between the AATSR data image (September 2002) and the Globcover map (December 2004 to June 2006). Previously, a coarse 0.5◦x0.5◦ resolution land cover map had been used. Figure 2 shows the improvement obtained by going to the higher spatial resolution offered by the GlobCover map. Application Cloud screening NDVI NDVI, Cloud flagging Pixel co- registration Cirrus detection over land Cloud clearing Vegetation State Cloud Clearing SST, LST Active Fire SST, LST Active Fire SST, LST Table. Some characteristics of the SLSTR channels and their intended uses. Figure 2. (a) LST retrieval using a coarse land cover map at 0.5 ◦x 0.5◦ resolution. (b) LST retrieval using the new GlobCover map at 1/120◦resolution. Comparisons Mean monthly nighttime and daytime LST comparisons between AATSR and MODIS for September, 2002 are shown In Figure 3. There is generally very good agreement in the patterns and the absolute values of the LSTs. The MODIS LST algorithm has a different basis to that for the AATSR (and SLSTR), treating the effects of the surface (emissivity) in a different manner. The agreement suggests that the use of land cover maps as a surrogate for land surface effects has some validity. Land Surface Temperature Retrieval Scheme Over the past 5 years the University of Leicester and NILU have been actively developing (and validating) satellite-based algorithms (e.g. using ATSR and AVHRR data) for estimating LST. These algorithms are soundly based on radiative transfer theory as applied to the exchange of radiation between the surface and atmosphere. The effects of land surface emissivity are implicitly taken into account in these algorithms. The basic algorithm may be stated as: LST = af,i,pw + bf,i(T11 − T12)n + (bf,i + cf,i)T12 where: n = cos(θ/m), θ is the view angle, i corresponds to vegetation type or class, and pw corresponds to precipitable water (in cm). The coefficients depend on atmospheric water vapour, viewing angle and land surface emissivity. The coefficients have the form: af,i,pw = d[sec(θ) − 1]pw + f av,i + (1 − f )as,i, bf,i = f bv,i + (1 − f )bs,i, cf,i = f cv,i + (1 − f )cs,i, 0 ≤ f ≤ 1, where f is the fractional vegetation cover, s is soil, v is vegetationValues for the coefficients have been determined using simulation data-sets. The essence of the algorithm is the recognition that over the land, both atmospheric water vapour effects and surface emissivity effects (spectral and angular) play important roles in modifying the amount of radiation reaching the satellite-borne radiometer. The approach adopted is to determine robust regression coefficients that can be used for classes of land cover conditions, atmospheric water vapour loadings and seasons. Originally there were 13 biomesthis has now been extended to 21 biomes using the GlobCover data-set. To include the effects of mixed land covers and allow for seasonal vegetation growth, coefficients are linearly combined and a time-dependency is included. Special coefficients are used for snow and ice covered surfaces. The advantages of this approach are: •Regression-based algorithms are fast and easy to implement on a computer. •The regression coefficients can be implemented as a lookup table and be updated in a routine manner. •Validation of the algorithms can be performed for a subset of surfaces by comparing LSTs directly, rather than by validating sets of input variables and parameters. Acknowledgement. This work is funded by ESA under the GMES Sentinel-3 mission program. Philippe Goryl (ESA) is thanked for his help and support. 1Dr Fred Prata (fpr@nilu.no) Climate and Atmosphere Department Norwegian Institute for Air Research, Norway. Figure 3. Top: Nighttime comparison between AATSR and MODIS mean monthly land surface temperatures. Bottom: Daytime comparison between AATSR and MODIS mean monthly land surface temperatures. Climate Application The ATSR series of instruments have been producing high precision surface temperature measurements for ∼18 years. Preliminary analyses of these data suggests that trends and changes in spatial patterns of thermal anomalies may be detected. Figure 4 shows some initial results for nighttime-only global monthly mean LSTs from the ATSR, the ATSR-2 and AATSR. A warming trend is discernible in this time-series from a mean of about 276 K at the end of 1991 to a mean of about 278 K by the end of 2009, but some issues with the calibration of the ATSR may be influencing this result. Figure 4. Mean monthly global nighttime-only land surface temperature retrievals from the ATSR, ATSR-2 and AATSR precision radiometers. 2Dr Olof Zeller, Dr Gary Corlett, Prof. John Remedios Space Science Centre University of Leicester, UK. 3Christian Kogler European Space Agency ESRIN, Italy. PP 04/2010
