What can RTTOV-9 do for me?
advertisement
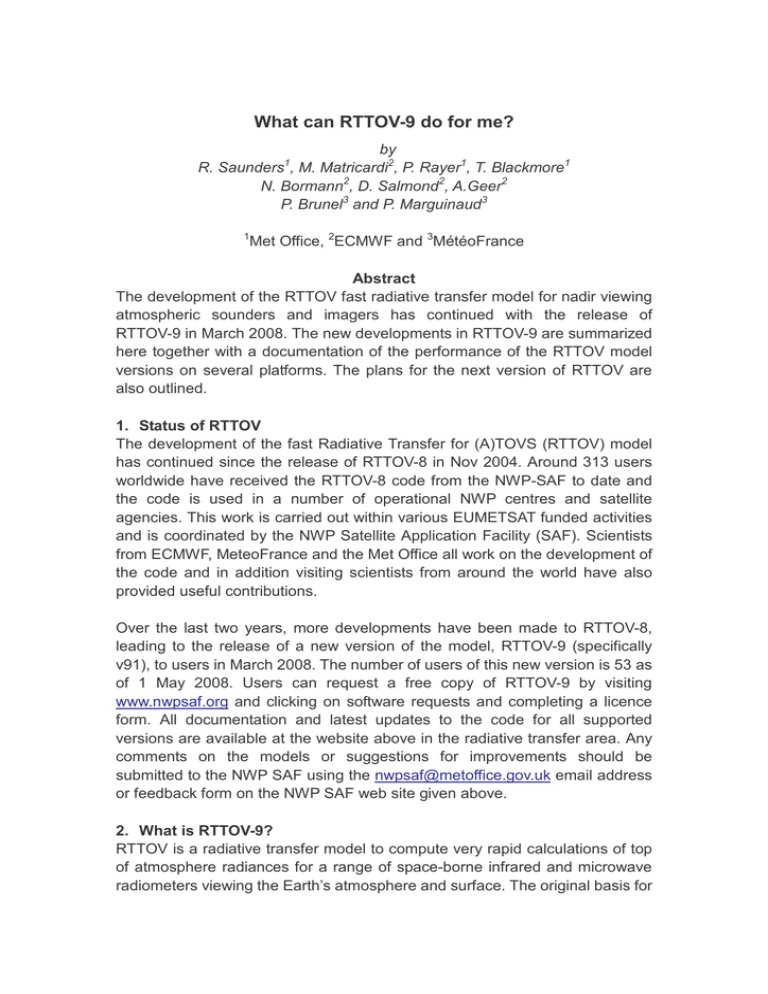
What can RTTOV-9 do for me? by R. Saunders , M. Matricardi2, P. Rayer1, T. Blackmore1 N. Bormann2, D. Salmond2, A.Geer2 P. Brunel3 and P. Marguinaud3 1 1 Met Office, 2ECMWF and 3MétéoFrance Abstract The development of the RTTOV fast radiative transfer model for nadir viewing atmospheric sounders and imagers has continued with the release of RTTOV-9 in March 2008. The new developments in RTTOV-9 are summarized here together with a documentation of the performance of the RTTOV model versions on several platforms. The plans for the next version of RTTOV are also outlined. 1. Status of RTTOV The development of the fast Radiative Transfer for (A)TOVS (RTTOV) model has continued since the release of RTTOV-8 in Nov 2004. Around 313 users worldwide have received the RTTOV-8 code from the NWP-SAF to date and the code is used in a number of operational NWP centres and satellite agencies. This work is carried out within various EUMETSAT funded activities and is coordinated by the NWP Satellite Application Facility (SAF). Scientists from ECMWF, MeteoFrance and the Met Office all work on the development of the code and in addition visiting scientists from around the world have also provided useful contributions. Over the last two years, more developments have been made to RTTOV-8, leading to the release of a new version of the model, RTTOV-9 (specifically v91), to users in March 2008. The number of users of this new version is 53 as of 1 May 2008. Users can request a free copy of RTTOV-9 by visiting www.nwpsaf.org and clicking on software requests and completing a licence form. All documentation and latest updates to the code for all supported versions are available at the website above in the radiative transfer area. Any comments on the models or suggestions for improvements should be submitted to the NWP SAF using the nwpsaf@metoffice.gov.uk email address or feedback form on the NWP SAF web site given above. 2. What is RTTOV-9? RTTOV is a radiative transfer model to compute very rapid calculations of top of atmosphere radiances for a range of space-borne infrared and microwave radiometers viewing the Earth’s atmosphere and surface. The original basis for the RTTOV fast computation of transmittances is described by Eyre and Woolf (1988). This was modified for later versions of RTTOV by Eyre (1991), Rayer (1995), Saunders et. al. (1999), Matricardi (2003) and Matricardi (2005). The performance of RTTOV-7 and RTTOV-8 for AIRS has been documented in Saunders et. al. (2007) by comparing with other fast and line-by-line radiative transfer models and AIRS observations. In summary, RTTOV-9 has the following attributes: • • • • • • • • • • • It comprises forward, tangent linear, adjoint and K (full Jacobian matrices) versions of the model; the latter three modules for variational assimilation or retrieval applications Top-of-atmosphere radiances, brightness temperatures and layer-to-space plus surface-to-space transmittance for each channel are output for a given input atmospheric profile. There are also other layer-to-space and layer-to-surface radiances output for computing cloudy radiances It takes about 0.5ms to compute radiances for 20 HIRS channels for one profile on a Linux PC The input profile must have as a minimum temperature and water vapour concentration. It can compute sea-surface emissivity for each channel internally or use a value provided by the user. The ISEM-6 model (Sherlock, 1999) is used for the infrared. The FASTEM model (Deblonde and English, 2001) is used for the microwave. There are also very simplistic values provided over land for both wavelength regions Cloud-top pressure and effective cloud amount can be specified for simple, single-layer cloudy radiance calculations A full cloud water/ice profile can also be supplied for cloudy radiance simulation with various overlap assumptions A wrapper code allows RTTOV to be used to compute rain-affected microwave radiances (RTTOV_SCATT) as described by Bauer et. al. (2006) It supports all the sensors given in the Table 1 for all the platforms the sensor has flown on It is written in Fortran-90, and run under unix or linux It has been tested on a range of platforms including vector and scalar supercomputers and linux PCs. Some performance statistics are given below in section 5. 3. The differences between RTTOV-8 and RTTOV-9 This section summarises the main scientific and technical differences between RTTOV-8 and RTTOV-9. More details can be found in the RTTOV-9 users guide and science and validation plan both available on the web site given above. The main differences are: • • • • • • • • • • • Now six variable gas profiles can be supplied to RTTOV (H2O, O3, CO2, + N2O, CO, CH4) with only H2O being mandatory Parameterised aerosol scattering for a range of user aerosol components for the infrared channels New cloud parameterised scattering for infrared sensors inside RTTOV Linear in optical depth approximation for the Planck function to improve the accuracy of the radiance computation Include reflected solar radiation for wavelengths below 5 microns. Further optimisation of optical depth computations for all gases for high resolution IR sensors (RTTOV-9 predictors) An altitude dependent variation of local zenith angle and optionally allow for atmospheric refraction to accurately compute the atmospheric path length Simplified interface to avoid the need to specify polarisation (NB microwave imager channel numbers are now different) The 2m surface humidity variable can now be an active variable in the state vector The Mie scattering tables have been extended to include the "total ice" hydrometeor type, as an alternative to separate "snow" and "cloud ice". The input profile levels can now be defined by the user and the layer radiances and transmittances output are on the same levels. This important new feature which allows better mapping of computed jacobians on to user levels, is described in more detail below. Allowing user defined input and output levels for RTTOV has been a request from users, for some time, to avoid the need for interpolation of the input profiles to ‘RTTOV levels’ within their codes. In addition users of the adjoint or K codes were finding missing levels in the computed jacobians from RTTOV-8 when the number of user levels were greater than the number of RTTOV levels because of the ‘nearest neighbour’ approach of the interpolators used. For these interpolators the value for a variable on a given target level comes from an interpolation between values on the two nearest source levels above and below. Therefore, when the RTTOV adjoint/K code is run, the interpolator does not necessarily use all the source levels to estimate a variable on the output profile levels. The final Jacobian column on user levels, a channel sensitivity profile, can suffer significant distortion compared to the case where no interpolation has been performed. The interpolator used in RTTOV-9 closely follows that described in Rochon et al. (2007), which has been designed to overcome this problem. It calculates a set of weights that, each time an interpolated value is required, will bring in all the source levels between the target level and its own neighbours above and below. Because it deals with triplets of target levels and the source levels used each time enter in a weighted sum, the method used is one of a piecewise weighted integration. In Figure 1 the inputs and output user levels are 101 whereas the internal RTTOV optical depth calculations are on 43 levels. Figure 1 clearly demonstrates the improvement obtained in the Jacobians when the weighted average interpolator is used for this case. Figure 1. Temperature jacobians from RTTOV-9 for the case of nearest neighbour interpolation (red) and weighted interpolation (black) as in RTTOV-9. 4. Sensors simulated by RTTOV-9 All supported versions of RTTOV (i.e. versions 7, 8 and 9) can simulate a range of different infrared and microwave sensors as listed in Table 1. This list is added to as required and plans are underway to include the NPOESS and Chinese FY-3 sensors during the next year. Note that only the infrared and microwave channels can be simulated at present. There is also a need to consider adding historical satellite sensors to the list for reanalyses and climate data record applications. Users can request new sensors to be added to the list supported by RTTOV. There have also been a number of studies where RTTOV has been used to simulate radiances from hypothetical sensors in order to evaluate their utility for atmospheric sounding. Platforms Sensor Channels TIROS-N HIRS, MSU, 1-19, 1-4 NOAA-6-18 SSU, AMSU-A 1-3, 1-15 NOAA-2-5 AMSU-B, MHS, 1-5, 1-5, METOP-2(A) AVHRR, VTPR 1-3,1-8 IASI 1-8461 DMSP F-8-15 SSM/I 1-7 DMSP F-16 SSMI(S) 1-24 Meteosat-2-9 MVIRI 2 SEVIRI 4-11 Imager 1-4 Sounder 1-18 ERS-1/2 ATSR 1-3 ENVISAT AATSR 1-3 GMS-5, MTSAT-1,2 Imager 1-3,1-4 Terra MODIS,AIRS 1-17, 1-2378 Aqua AMSU-A, HSB, AMSR 1-15, 1-4,1-14 TRMM TMI 1-9 Coriolis WindSat 1-10 FY-1, FY-2 MVISR, VISSR 1-3, 2-4 GOES-8-13 Table 1. List of sensors and platforms supported by RTTOV as of May 2008. 5. Comparisons between RTTOV-7, RTTOV-8 and RTTOV-9 for ATOVS The plot in Figure 2 below shows the standard deviation of the differences between line-by-line computed brightness temperatures and those computed by various versions of the RTTOV code using the same predictors for ATOVS. This verifies the correct implementation of the code and the performance for the original RTTOV-7 predictors which are still available in RTTOV-9. The computations were done for 117 diverse profiles and 5 different viewing angles. A fixed surface emissivity of 1 was assumed for all HIRS (channels 1-20) and 0.65 for AMSU (channels 21-40). Figure 2. Comparison of the performance of RTTOV-7, 8 and 9 for 117 diverse profiles assessed by the standard deviation of the difference between RTTOV and line-by-line computed radiances. 5. Performance of RTTOV-9 For every new version of RTTOV released the performance of the model in terms of speed and memory resources must be assessed before release to ensure it is not significantly slower or memory intensive without a good reason. Unfortunately this is not as simple as it appears because different computing platforms perform differently. Figure 3 shows the time required to compute 50,000 profiles for AMSU-A with no interpolation (tests 1 and 4), AMSU-A with interpolation (tests 2 and 5) and HIRS with no interpolation (tests 3 and 6). Tests 1 to 3 are for 50 profiles input to RTTOV for each call and tests 4 to 6 are for 1 profile input per call. Results for RTTOV-8, RTTOV-9 and various improved versions of RTTOV-9 are shown run on the Met Office NEC SX-6 supercomputer. There are a number of points that can be made from Figure 3. For a vector machine like the SX6 it is more efficient to call RTTOV with many profiles at a time (factor of 2 improvement in speed). This is not the case for a scalar machine like the IBM. The interpolation in RTTOV has a significant cost (more than a factor of 2). On the SX6 for single profiles per call RTTOV-9 is more expensive than RTTOV-8 whereas for many profiles per call the opposite is true. For scalar machines (not shown) RTTOV-9 is always faster than RTTOV-8. A newer optimized version of RTTOV-9 has significantly improved the performance for single profile calls making it close to RTTOV-8 performance. It should also be noted that RTTOV-9 can be run on a multiprocessor environment allowing run times to be reduced accordingly. In terms of memory 250 RTTOV-8 AMSU-A RTTOV-9 Official code Alloc inside New Interp 200 + interp Alloc outside new interp T im e secs 150 AMSU-A AMSU-A HIRS 100 + interp AMSU-A HIRS 50 0 1 2 50 profiles/call 3 4 Test number 5 6 1 profile/call Figure 3. Run times for 50,000 profiles for different versions of RTTOV on the NEC-SX6. resources both RTTOV-8 and RTTOV-9 use the same resources but note if the full IASI spectrum is computed then a large memory resource is required. 6. Future Plans for RTTOV-9 and RTTOV-10 Plans are now underway to develop enhancements to the RTTOV-9 model. These include the following: • Include Zeeman splitting for AMSU-A (channel 14) and SSMIS (channels 19-22), see paper from Yong Han in these proceedings. • Provide new LBLRTM based coefficients for AIRS/IASI and CrIS • Add Non-LTE using SARTA or similar approach • Rewrite coefficient generation software and make available to users • Upgrade FASTEM-3 microwave ocean surface emissivity • Upgrade FASTEM-3 over land for lower frequencies (SMOS, AMSR-E, TMI) • Make ‘hidden’ top layer to be defined by user • Add new SSU predictors for improving simulation of SSU radiances for reanalyses • Formulate design for including PCRTM capability to allow more efficient calculation of IASI spectrum • Add simple VIS/NIR optical depth and scattering calculations The items in italics are planned but are subject to external factors. 7. Acknoweldgements The authors acknowledge the support of EUMETSAT for RTTOV development and Yves Rochon of Environment Canada for providing the interpolator incorporated into RTTOV. 8. References Bauer, P., E. Moreau, F. Chevallier, U. O'Keeffe 2006 Multiple-scattering microwave radiative transfer for data assimilation applications. Quarterly Journal of the Royal Meteorological Society 132, 1259-1281. Deblonde, G. and S.J. English 2001. Evaluation of the FASTEM-2 fast microwave oceanic surface emissivity model. Tech. Proc. ITSC-XI Budapest, 20-26 Sept 2000, 67-78. Eyre J.R. and H.M. Woolf 1988. Transmittance of atmospheric gases in the microwave region: a fast model. Applied Optics 27 3244–3249. Eyre J.R. 1991. A fast radiative transfer model for satellite sounding systems. ECMWF Research Dept. Tech. Memo. 176 (available from the librarian at ECMWF). Rayer P.J. 1995. Fast transmittance model for satellite sounding. Applied Optics, 34 7387–7394. Matricardi, M. 2003. RTIASI-4, a new version of the ECMWF fast radiative transfer model for the infrared atmospheric sounding interferometer. ECMWF Research Dept. Tech. Memo. 425. http://www.ecmwf.int/publications Matricardi, M. 2005. The inclusion of aerosols and clouds in RTIASI, the ECMWF fast radiative transfer model for the infrared atmospheric sounding interferometer. ECMWF Research Dept. Tech. Memo. 474. http://www.ecmwf.int/publications Rochon, Y.J., L. Garand, D. S. Turner, S. Polavarapu 2007 Jacobian mapping between vertical coordinate systems in data assimilation. Quart. J. Roy. Meteorol. Soc. 133 1547-1558. Saunders R.W., M. Matricardi and P. Brunel 1999. An Improved Fast Radiative Transfer Model for Assimilation of Satellite Radiance Observations. Quart. J. Roy. Meteorol. Soc., 125, 1407–1425. Saunders, R.W. et. al. 2007. A comparison of radiative transfer models for simulating Atmospheric Infrared Sounder (AIRS) radiances. J. Geophys. Res., 112 D01S90, doi:10.1029/2006JD007088. Sherlock, V. 1999. ISEM-6: Infrared Surface Emissivity Model for RTTOV-6. NWP SAF report. http://www.metoffice.gov.uk/research/interproj/nwpsaf/rtm/papers/isem6.pdf
