Measurements of Stratospheric Volcanic Aerosol Optical Depth from NOAA/TOVS Observations Measurements of
advertisement
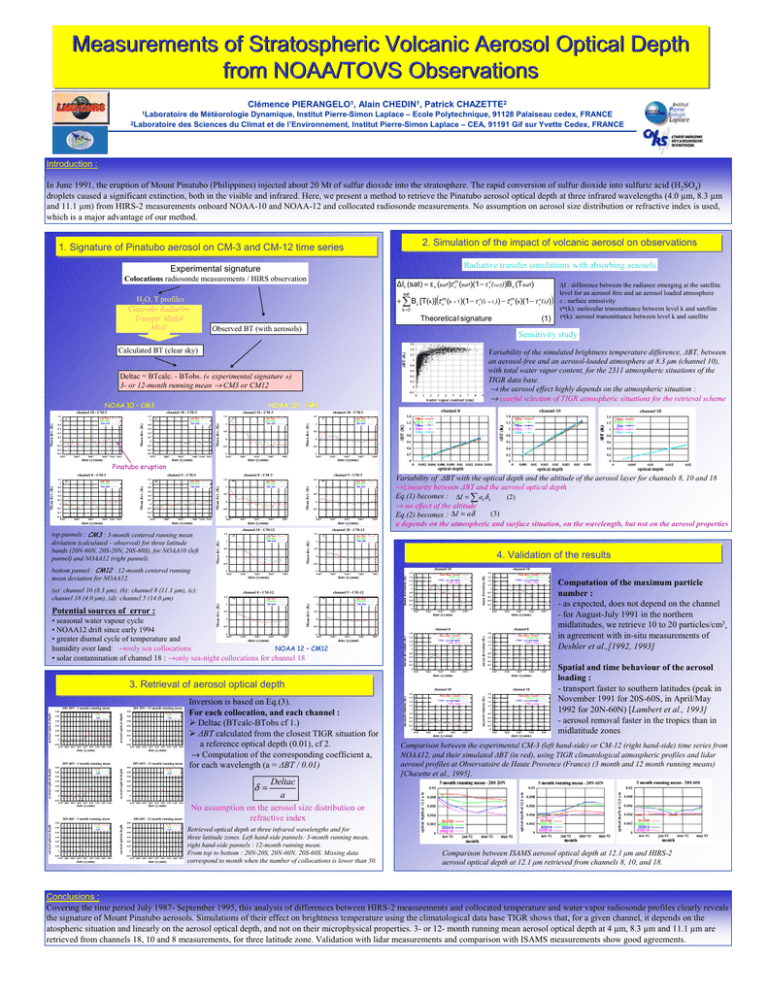
Measurements of Stratospheric Volcanic Aerosol Optical Depth from NOAA/TOVS Observations Clémence Clémence PIERANGELO PIERANGELO11,, Alain Alain CHEDIN CHEDIN11,, Patrick Patrick CHAZETTE CHAZETTE22 11Laboratoire de Météorologie Dynamique, Institut Pierre-Simon Laplace – Ecole Polytechnique, 91128 Palaiseau cedex, FRANCE Laboratoire de Météorologie Dynamique, Institut Pierre-Simon Laplace – Ecole Polytechnique, 91128 Palaiseau cedex, FRANCE 22Laboratoire des Sciences du Climat et de l’Environnement, Institut Pierre-Simon Laplace – CEA, 91191 Gif sur Yvette Cedex, FRANCE Laboratoire des Sciences du Climat et de l’Environnement, Institut Pierre-Simon Laplace – CEA, 91191 Gif sur Yvette Cedex, FRANCE Introduction : In June 1991, the eruption of Mount Pinatubo (Philippines) injected about 20 Mt of sulfur dioxide into the stratosphere. The rapid conversion of sulfur dioxide into sulfuric acid (H2SO4) droplets caused a significant extinction, both in the visible and infrared. Here, we present a method to retrieve the Pinatubo aerosol optical depth at three infrared wavelengths (4.0 µm, 8.3 µm and 11.1 µm) from HIRS-2 measurements onboard NOAA-10 and NOAA-12 and collocated radiosonde measurements. No assumption on aerosol size distribution or refractive index is used, which is a major advantage of our method. 2. Simulation of the impact of volcanic aerosol on observations 1. Signature of Pinatubo aerosol on CM-3 and CM-12 time series Radiative transfer simulations with absorbing aerosols Experimental signature Colocations radiosonde measurements / HIRS observation ∆Iν (sat) = εν (surf)τ ν (surf)(1− τ νa(surf))Bν (Tsurf) m sat ( + ∑ Bν [T(k)] τ νm (k + 1)(1− τ νa(k + 1 )) − τ νm (k)(1− τ νa(k)) H2O, T profiles Clear-sky Radiative Transfer Model 3R-N k =0 Theoretica l signature Variability of the simulated brightness temperature difference, ∆BT, between an aerosol-free and an aerosol-loaded atmosphere at 8.3 µm (channel 10), with total water vapor content, for the 2311 atmospheric situations of the TIGR data base. → the aerosol effect highly depends on the atmospheric situation : → careful selection of TIGR atmospheric situations for the retrieval scheme Deltac = BTcalc. - BTobs. (« experimental signature ») 3- or 12-month running mean → CM3 or CM12 NOAA 12 – CM3 0 -0.6 8707 8807 8907 9007 9101 9107 date (yymm) 8807 1.2 20S 20N 20N 60N 20S 60S b) 1 0.6 0.4 0.2 0 -0.2 9207 9307 9407 -1 9107 9507 9207 9307 9407 date (yymm) date (yymm) channel 8 - CM-3 channel 5 - CM-3 20S 20N 20N 60N 20S 60S d) 0.8 0.6 0.4 0.2 0 -0.2 1.5 b) 1.5 20S 20N 20N 60N 20S 60S 1 0.5 0 -0.5 d) 9507 20S 20N 20N 60N 20S 60S 1 0.5 0 -0.5 -0.4 8907 -0.6 8707 9007 9101 9107 8807 date (yymm) 8907 -1 9107 9007 9101 9107 9207 date (yymm) top pannels : CM3 : 3-month centered running mean deviation (calculated – observed) for three latitude bands (20N-60N, 20S-20N, 20S-60S), for NOAA10 (left pannel) and NOAA12 (right pannel). 9407 -1 9107 9507 9207 date (yymm) a) 0.5 0 -0.5 -1 9107 9207 9307 9407 c) 4. Validation of the results 0 -0.5 channel 10 -1 9107 9507 20S 20N 20N 60N 20S 60S 1 9207 Mean dev. (K) b) 0.5 d) -0.5 9207 9307 9407 9507 20S 20N 20N 60N 20S 60S 1 1.8 9507 channel 10 1.8 lidar data + model CM3 - sea CM3 - sea and night CM3 - total 1.6 1.4 1.2 1 0.8 0.6 0.4 0.2 0 lidar data + model CM12 - sea CM12 - sea and night CM12 - total 1.6 1.4 1.2 1 0.8 0.6 0.4 0.2 0 9107 0.5 • seasonal water vapour cycle • NOAA12 drift since early 1994 • greater diurnal cycle of temperature and date (yymm) NOAA 12 – CM12 humidity over land: →only sea collocations • solar contamination of channel 18 : →only sea-night collocations for channel 18 0 -1 9107 9407 channel 5 - CM-12 1.5 20S 20N 20N 60N 20S 60S 1 9307 date (yymm) channel 8 - CM-12 1.5 9507 0.5 date (yymm) (a): channel 10 (8.3 µm), (b): channel 8 (11.1 µm), (c): channel 18 (4.0 µm), (d): channel 5 (14.0 µm) 9407 channel 18 - CM-12 1.5 20S 20N 20N 60N 20S 60S 1 9307 date (yymm) channel 10 - CM-12 1.5 bottom pannel : CM12 : 12-month centered running mean deviation for NOAA12. Potential sources of error : 9307 Variability of ∆BT with the optical depth and the altitude of the aerosol layer for channels 8, 10 and 18 →Linearity between ∆BT and the aerosol optical depth Eq.(1) becomes : ∆I = ∑ akδ k (2) → no effect of the altitude ∆ I = a δ (3) Eq.(2) becomes : a depends on the atmospheric and surface situation, on the wavelength, but not on the aerosol properties mean deviation (K) 8807 Mean dev. (K) -0.6 8707 Mean dev. (K) -0.4 9007 9101 9107 0 -0.5 date (yymm) Mean dev. (K) Mean dev. (K) 1 0.8 Mean dev. (K) 1.2 8907 -1 9107 channel 5 - CM-3 Pinatubo eruption channel 8 - CM-3 0 -0.5 20S 20N 20N 60N 20S 60S 0.5 mean deviation (K) 0.2 -0.2 -0.4 -0.6 8707 0.5 c) 1 9201 9207 9301 9307 9107 9201 -0.5 -1 9107 1.8 9207 9307 9407 9507 date (yymm) channel 8 1.8 lidar data + model CM3 - sea CM3 - sea and night CM3 - total 1.6 1.4 1.2 1 0.8 0.6 0.4 0.2 lidar data + model CM12 - sea CM12 - sea and night CM12 - total 1.6 1.4 1.2 1 9201 9207 9301 3. Retrieval of aerosol optical depth 0.6 0.4 0.2 9307 9107 9201 0.02 0.01 0 -0.01 8707 8807 8907 9007 9107 9207 9307 9407 9507 0.05 0.03 0.02 0.01 0 -0.01 8707 8807 8907 9007 9107 9207 9307 9407 9507 date (yymm) date (yymm) 20N 60N - 3 month running mean 0.05 11.10 8.30 4.00 0.04 0.03 0.02 0.01 0 20N 60N - 12 month running mean 0.06 aerosol optical depth aerosol optical depth 0.06 -0.01 8707 8807 8907 9007 9107 9207 9307 9407 9507 0.05 0.05 11.10 8.30 4.00 0.04 0.03 0.01 0 date (yymm) date (yymm) 20S 60S - 3 month running mean 20S 60S - 12 month running mean 11.10 8.30 4.00 0.04 0.03 0.02 0.01 0 -0.01 8707 8807 8907 9007 9107 9207 9307 9407 9507 date (yymm) 0.06 0.05 Deltac a No assumption on the aerosol size distribution or refractive index 9307 1.2 1 0.8 0.6 0.4 0.2 0 lidar data + model CM12 - sea CM12 - sea and night CM12 - total 1.6 1.4 1.2 1 0.8 0.6 0.4 0.2 0 9107 9201 9207 9301 date (yymm) 9307 9107 9201 9207 9301 date (yymm) 9307 Spatial and time behaviour of the aerosol loading : - transport faster to southern latitudes (peak in November 1991 for 20S-60S, in April/May 1992 for 20N-60N) [Lambert et al., 1993] - aerosol removal faster in the tropics than in midlatitude zones Comparison between the experimental CM-3 (left hand-side) or CM-12 (right hand-side) time series from NOAA12, and their simulated ∆BT (in red), using TIGR climatological atmospheric profiles and lidar aerosol profiles at Observatoire de Haute Provence (France) (3 month and 12 month running means) [Chazette et al., 1995]. δ= 0.02 -0.01 8707 8807 8907 9007 9107 9207 9307 9407 9507 aerosol optical depth aerosol optical depth 0.06 11.10 8.30 4.00 0.04 mean deviation (K) 0.06 mean deviation (K) 11.10 8.30 4.00 0.03 aerosol optical depth aerosol optical depth 0.05 0.04 1.4 9301 channel 18 1.8 lidar data + model CM3 - sea CM3 - sea and night CM3 - total 1.6 9207 date (yymm) channel 18 1.8 Inversion is based on Eq.(3). For each collocation, and each channel : ¾ Deltac (BTcalc-BTobs cf 1.) ¾ ∆BT calculated from the closest TIGR situation for a reference optical depth (0.01), cf 2. → Computation of the corresponding coefficient a, for each wavelength (a = ∆BT / 0.01) Computation of the maximum particle number : - as expected, does not depend on the channel - for August-July 1991 in the northern midlatitudes, we retrieve 10 to 20 particles/cm3, in agreement with in-situ measurements of Deshler et al.,[1992, 1993] 0.8 date (yymm) 0.06 9307 0 9107 20S 20N - 12 month running mean 9301 date (yymm) channel 8 0 20S 20N - 3 month running mean 9207 date (yymm) 0 mean deviation (K) 0 -0.4 channel 18 - CM-3 1.5 20S 20N 20N 60N 20S 60S Mean dev. (K) 0.2 -0.2 0.4 a) 1 Mean dev. (K) 0.4 0.6 channel 10 - CM-3 1.5 Mean dev. (K) 0.6 20S 20N 20N 60N 20S 60S c) 0.8 Mean dev. (K) 1 Mean dev. (K) Mean dev. (K) channel 18 - CM-3 1.2 20S 20N 20N 60N 20S 60S a) mean deviation (K) NOAA 10 – CM3 channel 10 - CM-3 1 0.8 ∆I : difference between the radiance emerging at the satellite level for an aerosol free and an aerosol loaded atmosphere ε : surface emissivity τm(k): molecular transmittance between level k and satellite τa(k): aerosol transmittance between level k and satellite Sensitivity study Calculated BT (clear sky) 1.2 (1) Observed BT (with aerosols) ) 11.10 8.30 4.00 0.04 0.03 0.02 0.01 0 -0.01 8707 8807 8907 9007 9107 9207 9307 9407 9507 date (yymm) Retrieved optical depth at three infrared wavelengths and for three latitude zones. Left hand-side pannels: 3-month running mean, right hand-side pannels : 12-month running mean. From top to bottom : 20N-20S, 20N-60N, 20S-60S. Missing data correspond to month when the number of collocations is lower than 50. Comparison between ISAMS aerosol optical depth at 12.1 µm and HIRS-2 aerosol optical depth at 12.1 µm retrieved from channels 8, 10, and 18. Conclusions : Covering the time period July 1987- September 1995, this analysis of differences between HIRS-2 measurements and collocated temperature and water vapor radiosonde profiles clearly reveals the signature of Mount Pinatubo aerosols. Simulations of their effect on brightness temperature using the climatological data base TIGR shows that, for a given channel, it depends on the atospheric situation and linearly on the aerosol optical depth, and not on their microphysical properties. 3- or 12- month running mean aerosol optical depth at 4 µm, 8.3 µm and 11.1 µm are retrieved from channels 18, 10 and 8 measurements, for three latitude zone. Validation with lidar measurements and comparison with ISAMS measurements show good agreements.
