Correlations between microphysical properties of large - scale
advertisement
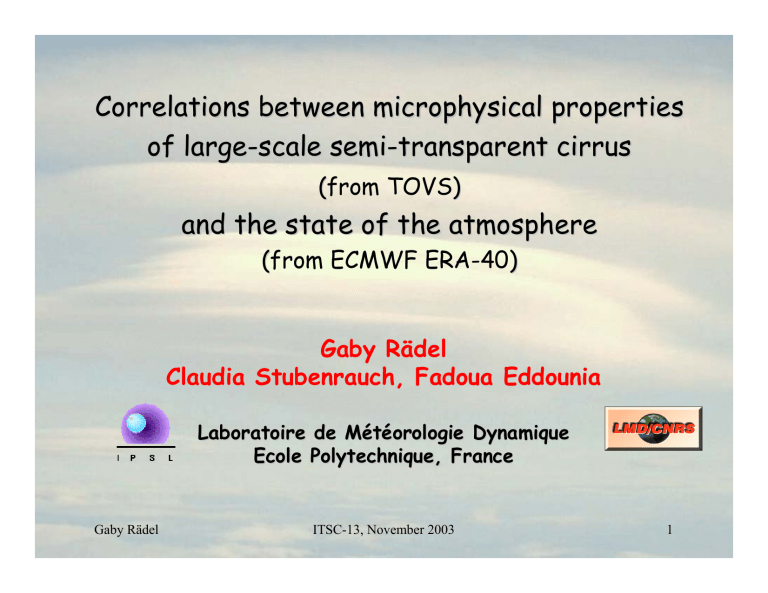
Correlations between microphysical properties of large-scale semi-transparent cirrus (from TOVS) and the state of the atmosphere (from ECMWF ERA-40) Gaby Rädel Claudia Stubenrauch, Fadoua Eddounia Laboratoire de Météorologie Dynamique Ecole Polytechnique, France Gaby Rädel ITSC-13, November 2003 1 Effective ice crystal size (De) and IWP retrieval of semi-transparent cirrus based on: spectral difference of cirrus emissivities at 11-8 µm Observations: NOAA10 1987 – 1991, 60°N – 60°S , θv< 25° large-scale cirrus: 1°x1° overcast, pcld<440 hPa 3R radiative transfer Tcld < 263K,TBmeas(8µm), TBmeas(11µm), Tcld, Tsurf εsurf(SARB), closest TIGR H2O/T profiles (ε8µm,ε11µm) Method: simulate ε(λ,De,IWP,θ) hom. cloud, βabs(De),<ω0(De)>,<g(De)> planar polycrystals (mod. ADA) bimodal size distribution Gaby Rädel radiative transfer (Streamer (J.Key)) vary De, IWP ITSC-13, November 2003 ε(λ,De,IWP,θ) 2 De and IWP retrieval (cont.) produce look-up tables: De = f(ε8µm,ε11µm), IWP = f (De,ε11µm) ε11 ε11−ε8 ε11 for De 0.3 < ε11µm < 0.85 0.7 < τVIS < 3.8 sensitivity up to De ≤ 80µm Gaby Rädel IWP ITSC-13, November 2003 IWP 3 Sensitivity study on ice crystal size retrieval Rädel et al., J. Geophys. Res., May 2003 NOAA10 global average : <De> = 55µm <IWP>= 30 g/m2 possible errors: Overestimation of De: thin Ci with underlying water cloud partial cover of thick Ci different crystal shapes, e.g. hexagonal columns instead of polycrystals Underestimation of De: vertical heterogeneity, i.e.: increasing De with cloud depth broader size distribution Gaby Rädel ITSC-13, November 2003 4 Evaluation of TOVS cloud height with LITE (newest LITE inversion by L. Sauvage) 796 TOVS low clouds 560 LITE single- 236 multi-layer 495 TOVS high clouds 161 LITE single- 334 multi-layer heterogenous scenes very thin LITE high clouds zTOVS – 0.5(ztop+zbase)LITE (km) single layer: |∆z|<1 km: 70% peak at 0 zTOVS – 0.5(ztop+zbase)LITE (km) |∆z| < 2 km : 60 % peak at –0.5 km Pcld(TOVS) ≈ pcld(mid-cloud) better agreement for low large-scale cirrus clouds LITE: ztop-zbase: Gaby Rädel low clouds 1.3 km high clouds 2.7 km ITSC-13, November 2003 5 Regional and seasonal variations of De and IWP TOVS NOAA10 3-year averages Nε IWP 30 70 65 25 20 60 55 win spg sum aut 15 win De 65 eff. Diameter (micron) 35 IWP (g/m2) eff. emissivity (%) 75 NH ocean 60 NH land 55 trop. Ocean trop. Land 50 SH ocean 45 SH land 40 NH z=2km trop. z=2km 35 SH z=2km spg sum aut 30 win spg sum aut Nε(SHm) > Nε(NHm) > Nε(trop) NH land: Nε(sum) < Nε(win) IWP(trop) > IWP(NHm) > IWP(SHm) land: IWP(midsum) > IWP(midwin) De(trop) > De(NHm) > De(SHm) land: De(midsum) > De(midwin) Gaby Rädel ITSC-13, November 2003 6 De and IWP as function of cloud temperature De90 Large-scale semi-transparent cirrus 60°N –60°S 55 7,5 80 22,5 37,5 IWP all different IWP 45 60 IWP (g/m2) De (micron) 70 50 40 30 35 25 20 10 200 different De 15 32,5 210 220 230 240 250 260 270 5 200 210 Gaby Rädel 220 62,5 230 240 82,5 250 all 260 270 Tcld (K) Tcld (K) cold cirrus: 47,5 De depends more on IWP than on Tcld IWP increases with Tcld ITSC-13, November 2003 7 Regional dependence for thin and thick Cirrus thin cirrus 90 midlatitudes 80 thick cirrus midlatitudes thin cirrus 55 midlatitudes all 52,5 50 40 60 IWP (g/m2) 60 50 40 30 30 20 20 45 35 25 220 230 240 250 260 10 200 270 210 220 Tcld (K) 90 250 80 70 70 60 50 40 30 tropics 5 200 ->Tcld tropics55 260 270 210 220 230 240 250 260 5 200 270 50 40 220 230 tropics 62,5 47,5 240 all 82,5 270 ->Tcld 250 260 Tcld (K) 55 tropics all 82,5 45 45 60 210 Tcld (K) 32,5 IWP (g/m2) tropics 80 35 25 35 25 30 20 210 220 230 240 7,5 250 Tcld (K) 260 270 10 200 15 15 20 all 37,5 22,5 7,5 10 200 240 Tcld (K) De (micron) De (micron) 90 230 62,5 47,5 32,5 IWP (g/m2) 210 25 all 37,5 22,5 7,5 35 15 15 10 200 thick cirrus IWP midlatitudes all 82,5 45 70 De (micron) De (micron) 37,5 22,5 7,5 62,5 47,5 32,5 80 70 55 midlatitudes IWP (g/m2) De90 210 37,5 22,5 220 230 240 Tcld (K) all 52,5 250 260 270 ->Tcld 5 200 210 220 230 240 250 260 270 5 200 210 62,5 47,5 32,5 220 230 different behaviour in midlatitudes and tropics thick Ci in tropics: De and IWP do not depend strongly on T, almost no scatter due to different IWP or De Gaby Rädel Tcld (K) ITSC-13, November 2003 240 Tcld (K) all 82,5 ->Tcld 250 260 8 270 Atmospheric properties accompanying large-scale cirrus ERA-40 ECMWF reanalyses: ¾humidity, U, V and W for 23 pressure levels ¾Every 6 hours, 1.125° x 1.125° spatial resolution Co-location with TOVS observations: (1989, 1990) Water vapour (cm) Horizontal wind (m/s) Frequency of situations with strong strong mean RMS mean RMS updraft no wind downdraft NH midlatitude summer 3.0 1.2 14.5 10.9 9% 38% 3% NH midlatitude winter 1.4 0.8 26.1 15.8 13% 29% 7% tropics 5.0 0.9 7.6 6.0 7% 44% 0.1% SH midlatitude summer 2.3 1.0 23.4 13.8 6% 42% 4% SH midlatitude winter 1.5 0.8 22.3 15.2 10% 34% 4% tropics: largest water vapour, smallest winds midlat. winter: strongest winds SH: horizontal winds always strong most large-scale semi-transparent cirrus in situations with no vertical wind Gaby Rädel ITSC-13, November 2003 9 De and IWP as function of humidity and wind Large-scale semi-transparent cirrus 60 N – 60 S, Tcld < 233K Stubenrauch et al. 2003, submitted to Atmos.Res. De and IWP increase with water vapour De 12 µm smaller in case of strong winds IWP 10 gm-2 larger in case of strong vertical updraft Gaby Rädel ITSC-13, November 2003 10 Regional distributions of De and IWP as function of humidity and wind dry, strong updraft dry, strong hor. wind De humid, strong updraft humid, strong hor. wind IWP De larger in case with no winds than strong winds humid tropics: IWP larger in case of strong w than strong u+v Gaby Rädel ITSC-13, November 2003 11 Cirrus horizontal extent determine horizontal extent of cirrus clouds (ε > 0.3): a. empty boxes are filled with ‘most likely’ information on cirrus type b. simple clustering algorithm groups adjacent boxes containing ), cirrus (0.95>ε>0.5 ) deep convection (ε>0.95 or thin cirrus (0.5>ε>0.3 ) Examples: 18/07/1989 and 30/12/1989 7h30 PM very thin Ci clear sky mid and low clouds thin Ci Ci deep conv. Gaby Rädel ITSC-13, November 2003 12 Cirrus horizontal extent cirrus clusters: largest in tropics smallest in ML summer De as fct. of distance to convective centre: De small if very close to convective centre and in smaller clusters -> dynamics? (1 box = 100 x 100 km) small clusters (<20boxes) large clusters (>500boxes) Gaby Rädel ITSC-13, November 2003 13 Conclusions and Outlook Large-scale semi-transparent cirrus: <De>=55µm <IWP>=30g/m2 IWP increases with Tcld TOVS Path-B & ECMWF reanalyses Æ De and IWP increase with atmospheric water vapour, increase depends on vertical updraft, hor. wind, formation processes? Study De as function of cirrus size and location to convective center for different dynamic situations Find parameterizations IWP =f (q,w,T), De=f (IWP,q,w,u+v,T) using also cluster information Gaby Rädel ITSC-13, November 2003 14
